背景
Nginx是一款功能强大的Web服务器,对于网络环境中的日志记录和配置至关重要。定制化Nginx日志格式可以帮助管理员更好地监控服务器性能、分析用户行为并做出相应优化。在本文中,我们将深入探讨Nginx日志格式的高级定制化策略,包括理解基础日志结构、日志格式自定义实例、模块集成与扩展以及日志切割与管理。
Nginx的自定义日志(指标全面)
Nginx之间的日志追踪(分析整个流程)
Nginx自定义日志格式
1. 理解基础日志结构
log_format 有一个默认的无需设置的 combined 日志格式,相当于apache 的 combined 日志格式,如下所示:
log_format combined '$remote_addr - $remote_user [$time_local] '
' "$request" $status $body_bytes_sent '
' "$http_referer" "$http_user_agent" ';
Nginx默认日志格式包含多个字段,每个字段都提供了有用的信息来帮助分析服务器行为。以下是一些常见字段及其含义:
$remote_addr: 客户端的IP地址$remote_user: 客户端用户的名称$time_local: 访问时间与时区$request: 完整的HTTP请求行,包括请求方法、URI和协议$status: 服务器响应的HTTP状态码$body_bytes_sent: 发送给客户端的字节数,不包括响应头的大小$http_referer: 客户端发送的HTTP Referer头部信息$http_user_agent: 客户端发送的User-Agent头部信息
这些字段的组合可以提供全面的请求和响应信息,有助于分析用户行为和服务器性能。
如果 nginx 位于负载均衡器, squid, nginx 反向代理之后, web 服务器无法直接获取到客户端真实的 IP 地址了。
$remote_addr 获取反向代理的 IP 地址。反向代理服务器在转发请求的 http 头信息中,可以增加 X-ForwardedFor 信息,用来记录 客户端 IP 地址和客户端请求的服务器地址。 如下所示:
log_format porxy '$http_x_forwarded_for - $remote_user [$time_local] '
' "$request" $status $body_bytes_sent '
' "$http_referer" "$http_user_agent" ';
2. 日志格式自定义实例
通过Nginx的access_log指令,管理员可以轻松自定义日志格式
具体log_format的语法如下:
log_format name [escape=default|json|none] string ...;
每一个日志格式都有一个名称,然后在配置access_log的时候可以指定用哪种格式来进行记录日志。log_format只能定义在http块中。查看在Nginx配置文件中的定义:
http {
	#可以定义多个log_format,名称只需要不一样即可
    log_format  main  '$remote_addr - $remote_user [$time_local] "$request" '
                      '$status $body_bytes_sent "$http_referer" '
                      '"$http_user_agent" "$http_x_forwarded_for"';
}

server {
    access_log              /var/log/nginx/access.log main; # 注意这里的配置
    error_log               /var/log/nginx/error.log;
}
如上在http块中定义了一个名称为main的日志格式,在server块中通过名称对该日志格式进行了引用,这样子日志的格式都会按找main中定义的一些属性来进行记录访问信息。
通过上边对日志格式和日志文件的一些了解,我们就可以非常容易的把日志的格式设置成JSON了,只需要定义一个log_format,把它的格式定义成一个json字符串,然后在打印日志的时候引用这个格式就可以实现了,下边是一个完成的定义文件:(可根据自己的需求定制)
第一种 程序友好型json格式:
log_format json escape=json '{'
    '"time_iso8601": "$time_iso8601", ' # local time in the ISO 8601 standard format
    '"request_time": "$request_time", ' # request processing time in seconds with msec resolution
    '"status": "$status", ' # response status code
    '"body_bytes_sent": "$body_bytes_sent", ' # the number of body bytes exclude headers sent to a client
    '"bytes_sent": "$bytes_sent", ' # the number of bytes sent to a client
    '"remote_addr": "$remote_addr", ' # client IP
    '"remote_user": "$remote_user", ' # client HTTP username
    '"remote_port": "$remote_port", ' # client port
    '"request_uri": "$request_uri", ' # full path and arguments if the request
    '"args": "$args", ' # args
    '"request_id": "$request_id", ' # the unique request id
    '"connection": "$connection", ' # connection serial number
    '"connection_requests": "$connection_requests", ' # number of requests made in connection
    '"pid": "$pid", ' # process pid
    '"request_length": "$request_length", ' # request length (including headers and body)
    '"time_local": "$time_local", '
    '"http_referer": "$http_referer", ' # HTTP referer
    '"http_user_agent": "$http_user_agent", ' # user agent
    '"http_x_forwarded_for": "$http_x_forwarded_for", ' # http_x_forwarded_for
    '"http_host": "$http_host", ' # the request Host: header
    '"server_name": "$server_name", ' # the name of the vhost serving the request
    '"ssl_protocol": "$ssl_protocol", ' # TLS protocol
    '"ssl_cipher": "$ssl_cipher", ' # TLS cipher
    '"scheme": "$scheme", ' # http or https
    '"request_method": "$request_method", ' # request method
    '"server_protocol": "$server_protocol", ' # request protocol, like HTTP/1.1 or HTTP/2.0
    '"pipe": "$pipe", ' # "p" if request was pipelined, "." otherwise
    '"gzip_ratio": "$gzip_ratio", '
    '"http_cf_ray": "$http_cf_ray", '
    '"request_host": "$host", '
    '"is_completion": "$request_completion", '
    '"upstream": "$upstream_addr", ' # upstream backend server for proxied requests
    '"upstream_name": "$proxy_host", ' # upstream name
    '"upstream_status": "$upstream_status", ' # upstream status
    '"upstream_bytes_sent": "$upstream_bytes_sent", ' # upstream bytes sent
    '"upstream_bytes_received": "$upstream_bytes_received", ' # upstream bytes received
    '"upstream_connect_time": "$upstream_connect_time", ' # upstream handshake time incl. TLS
    '"upstream_header_time": "$upstream_header_time", ' # time spent receiving upstream headers
    '"upstream_response_time": "$upstream_response_time", ' # time spend receiving upstream body
    '"upstream_response_length": "$upstream_response_length", ' # upstream response length
    '"upstream_cache_status": "$upstream_cache_status", ' # cache HIT/MISS where applicable
    '"nginx_host": "$hostname"'
'}';
json格式对程序友好,配合ELK等日志采集、分析系统使用很方便,方便对日志进行深度分析。但是多数人平时比较喜欢直接查看日志文件,这时json格式的日志文件看起来就不够清晰了,日志较长,冗余信息较多,使用shell命令进行统计和分析也不方便。
{"time_iso8601": "2024-04-10T16:55:26+08:00", "request_time": "0.009", "status": "200", "body_bytes_sent": "397", "bytes_sent": "916", "remote_addr": "192.168.96.19", "remote_user": "", "remote_port": "8145", "request_uri": "/default_sso_heartbeat.html", "args": "", "request_id": "c002e29f30c5e85a01dc1927991a9175", "connection": "759864", "connection_requests": "1", "pid": "8459", "request_length": "1017", "time_local": "10/Apr/2024:16:55:26 +0800", "http_referer": "https://apollo.ownit.top/default_sso_heartbeat.html", "http_user_agent": "Mozilla/5.0 (Windows NT 10.0; Win64; x64) AppleWebKit/537.36 (KHTML, like Gecko) Chrome/123.0.0.0 Safari/537.36", "http_x_forwarded_for": "", "http_host": "apollo.ownit.top", "server_name": "apollo.ownit.top", "ssl_protocol": "TLSv1.2", "ssl_cipher": "ECDHE-RSA-AES256-GCM-SHA384", "scheme": "https", "request_method": "GET", "server_protocol": "HTTP/1.1", "pipe": ".", "gzip_ratio": "", "http_cf_ray": "", "request_host": "apollo.ownit.top", "is_completion": "OK", "upstream": "192.168.102.40:80", "upstream_name": "kubernetes-cluster", "upstream_status": "200", "upstream_bytes_sent": "1100", "upstream_bytes_received": "880", "upstream_connect_time": "0.000", "upstream_header_time": "0.009", "upstream_response_time": "0.009", "upstream_response_length": "397", "upstream_cache_status": "", "nginx_host": "bt"}
第二种 运维友好型自定义格式:
log_format  main  escape=json
    '$remote_addr |$ipdb_raw |[$time_local] |$host |$request |$status |BodySent:$body_bytes_sent |ReqTime:$request_time |$request_completion |$http_x_forwarded_for |$proxy_host |$upstream_addr |$upstream_status |$upstream_cache_status |UpResTime:$upstream_response_time |UpConnTime:$upstream_connect_time |UpResLen:$upstream_response_length |$hostname-$request_id |$scheme |$request_body |$http_referer |$http_user_agent |$http_cookie';
这种格式使用“|”作为分隔符,日志打印也不是很长,方便使用AWK等命令进行统计
需注意以下几点:
- $ipdb_raw这个变量是ipip.net ip库的nginx模块,如果未使用这个模块会报错,去掉或换成GEOIP即可。
- escape=json 表示以json格式输出,高版本的Nginx已经支持json格式,对于第二种自定义格式,开启这个参数能在access log中打印中文,不会乱码
$http_cookie是打印所有cookies,当然也可以打印session,对于高安全要求的情况,日志中不会允许泄漏用户cookies。但是某些情况需调试或打印非敏感的cookies,可以打印指定cookies,如打印nginx session sticky生产的cookies,假设名字叫backend: ‘TRACE:$cookie_backend’。$hostname-$request_id 如果有做全局调用链分析的需求,这个参数可以做为全局的UUID,nginx对每个请求都生成一个唯一的UUID,传给后端工程打印出来即可。
模块集成与扩展
通过集成第三方模块,如ngx_http_geoip_module和ngx_http_log_module,可以进一步丰富日志信息。ngx_http_geoip_module允许在日志中添加客户端的地理位置信息,例如国家、城市等,这对于分析用户的地理分布非常有用。ngx_http_log_module则提供了灵活的日志配置选项,包括基于变量的日志记录和条件日志记录,使日志记录更加精细和高效。
请参考:
https://blog.csdn.net/fishinhouse/article/details/88966258
https://blog.csdn.net/zzhongcy/article/details/86214969
日志切割与管理
日志文件的定期滚动分割是日志管理中的一个重要方面。这可以通过设置定时任务(如使用cron)来实现,以定期执行日志切割操作,例如每天或每周切割一次日志文件。此外,还需要考虑日志的归档和安全存储,确保日志数据在保持可访问性的同时,不会因过时或安全问题而遭到破坏。使用如logrotate等工具可以帮助实现这些日志管理任务,保证日志数据的完整性和安全性。
通过深入探索这些策略,可以实现对Nginx服务器日志记录的精细化配置,从而为应用程序的监控和分析提供强大的支持
在Nginx的使用过程中,如果不对Nginx的日志做自定义的配置的话,那么默认的access.log日志默认就只有这么一个日志文件,随着系统使用时间越来越就,日志文件就会越来越大,而且默认的日志记录的格式也不方便分析。所以我们在实际使用Nginx的过程中需要对其日志做一些配置。
在http配置块中进行配置,也可以在每个server块中配置不同的access_log用以区分
http{
    # 定义一个变量来存储年月日
    map $time_iso8601 $date {
        default "date-not-found";
        '~^(?<ymd>\d{4}-\d{2}-\d{2})' $ymd;
    }
    # 定义一个变量来存储时分秒
    map $time_iso8601 $time {
        default "time-not-found";
        '~T(?<hms>\d{2}:\d{2}:\d{2})' $hms;
    }
    # 定义日志格式为json格式
    log_format json_format '{
        "timestamp": "$date $time",
        "remote_addr": "$remote_addr",
        "remote_user": "$remote_user",
        "request": "$request",
        "status": "$status",
        "body_bytes_sent": "$body_bytes_sent",
        "http_referer": "$http_referer",
        "http_user_agent": "$http_user_agent",
        "http_x_forwarded_for": "$http_x_forwarded_for"
}';
    # 定义一个变量来存储年月,可用来作为access.log的日志文件名,按月自动分割日志
    map $time_iso8601 $logmonth {
    '~^(?<ym>\d{4}-\d{2})' $ym;
    default 'date-not-found';
    }
    # 定义一个变量来存储年月日,可用来作为access.log的日志文件名,按天自动分割日志
    map $time_iso8601 $logdate {
    '~^(?<ymd>\d{4}-\d{2}-\d{2})' $ymd;
    default 'date-not-found';
    }
    # 开启access.log日志,可设置日志名变量(这里选择上面的按天)以便分割日志;可设置日志格式,以便更直观分析日志
    access_log logs/access-$logdate.log json_format;
}
Nginx的日志常见配置项
$args                    #请求中的参数值
$query_string            #同 $args
$arg_NAME                #GET请求中NAME的值
$is_args                 #如果请求中有参数,值为"?",否则为空字符串
$uri                     #请求中的当前URI(不带请求参数,参数位于$args),可以不同于浏览器传递的$request_uri的值,它可以通过内部重定向,或者使用index指令进行修改,$uri不包含主机名,如"/foo/bar.html"。
$document_uri            #同 $uri
$document_root           #当前请求的文档根目录或别名
$host                    #优先级:HTTP请求行的主机名>"HOST"请求头字段>符合请求的服务器名.请求中的主机头字段,如果请求中的主机头不可用,则为服务器处理请求的服务器名称
$hostname                #主机名
$https                   #如果开启了SSL安全模式,值为"on",否则为空字符串。
$binary_remote_addr      #客户端地址的二进制形式,固定长度为4个字节
$body_bytes_sent         #传输给客户端的字节数,响应头不计算在内;这个变量和Apache的mod_log_config模块中的"%B"参数保持兼容
$bytes_sent              #传输给客户端的字节数
$connection              #TCP连接的序列号
$connection_requests     #TCP连接当前的请求数量
$content_length          #"Content-Length" 请求头字段
$content_type            #"Content-Type" 请求头字段
$cookie_name             #cookie名称
$limit_rate              #用于设置响应的速度限制
$msec                    #当前的Unix时间戳
$nginx_version           #nginx版本
$pid                     #工作进程的PID
$pipe                    #如果请求来自管道通信,值为"p",否则为"."
$proxy_protocol_addr     #获取代理访问服务器的客户端地址,如果是直接访问,该值为空字符串
$realpath_root           #当前请求的文档根目录或别名的真实路径,会将所有符号连接转换为真实路径
$remote_addr             #客户端地址
$remote_port             #客户端端口
$remote_user             #用于HTTP基础认证服务的用户名
$request                 #代表客户端的请求地址
$request_body            #客户端的请求主体:此变量可在location中使用,将请求主体通过proxy_pass,fastcgi_pass,uwsgi_pass和scgi_pass传递给下一级的代理服务器
$request_body_file       #将客户端请求主体保存在临时文件中。文件处理结束后,此文件需删除。如果需要之一开启此功能,需要设置client_body_in_file_only。如果将次文件传 递给后端的代理服务器,需要禁用request body,即设置proxy_pass_request_body off,fastcgi_pass_request_body off,uwsgi_pass_request_body off,or scgi_pass_request_body off
$request_completion      #如果请求成功,值为"OK",如果请求未完成或者请求不是一个范围请求的最后一部分,则为空
$request_filename        #当前连接请求的文件路径,由root或alias指令与URI请求生成
$request_length          #请求的长度 (包括请求的地址,http请求头和请求主体)
$request_method          #HTTP请求方法,通常为"GET"或"POST"
$request_time            #处理客户端请求使用的时间,单位为秒,精度毫秒; 从读入客户端的第一个字节开始,直到把最后一个字符发送给客户端后进行日志写入为止。
$request_uri             #这个变量等于包含一些客户端请求参数的原始URI,它无法修改,请查看$uri更改或重写URI,不包含主机名,例如:"/cnphp/test.php?arg=freemouse"
$scheme                  #请求使用的Web协议,"http" 或 "https"
$server_addr             #服务器端地址,需要注意的是:为了避免访问linux系统内核,应将ip地址提前设置在配置文件中
$server_name             #服务器名
$server_port             #服务器端口
$server_protocol         #服务器的HTTP版本,通常为 "HTTP/1.0" 或 "HTTP/1.1"
$status                  #HTTP响应代码
$time_iso8601            #服务器时间的ISO 8610格式
$time_local              #服务器时间(LOG Format 格式)
$cookie_NAME             #客户端请求Header头中的cookie变量,前缀"$cookie_"加上cookie名称的变量,该变量的值即为cookie名称的值
$http_NAME               #匹配任意请求头字段;变量名中的后半部分NAME可以替换成任意请求头字段,如在配置文件中需要获取http请求头:"Accept-Language",$http_accept_language即可
$http_cookie
$http_host               #请求地址,即浏览器中你输入的地址(IP或域名)
$http_referer            #url跳转来源,用来记录从那个页面链接访问过来的
$http_user_agent         #用户终端浏览器等信息
$http_x_forwarded_for
$sent_http_NAME          #可以设置任意http响应头字段;变量名中的后半部分NAME可以替换成任意响应头字段,如需要设置响应头Content-length,$sent_http_content_length即可
$sent_http_cache_control
$sent_http_connection
$sent_http_content_type
$sent_http_keep_alive
$sent_http_last_modified
$sent_http_location
$sent_http_transfer_encoding
Nginx之间的日志追踪
在当今互联网架构中,Web应用防火墙(WAF)与Nginx作为前端代理的整合越来越常见,特别是在提升Web应用程序的安全性方面。这种结构不仅增强了对应用的保护,还提升了系统的整体性能。在这种架构中,理解WAF与Nginx如何协作,以及如何实现日志追踪的整合尤为重要。
WAF与Nginx协作原理
WAF通常作为Nginx的上游组件部署,拦截向Web应用程序发起的请求。它的主要作用是评估每个请求中的潜在威胁,如SQL注入、跨站脚本(XSS)等,然后根据预定义的规则集来决定是否允许请求通过。通过与Nginx的紧密协作,WAF能够在请求到达应用服务器之前提供一层额外的保护。
在请求和响应过程中,WAF与Nginx之间的交互涉及到请求的接收、分析、处理和转发。当WAF检测到潜在威胁时,可以决定直接阻止该请求,或者将其转发给Nginx进行进一步的处理。
日志集成挑战与解决方案
在将WAF与Nginx整合进一致性和可追溯性的日志系统时,面临的挑战主要包括跨组件的日志同步和关联。日志记录需要从WAF到Nginx,再到应用服务器,形成一个连续的链路,以确保对整个请求-响应周期的完全可见性。
为了解决这一挑战,一种方法是在所有组件中使用统一的日志ID。通过在HTTP头部插入一个唯一的跟踪标识符,例如通过X-Request-ID,可以跨多个系统跟踪单个请求,从而简化日志数据的关联和分析。
用户访问流程日志分析
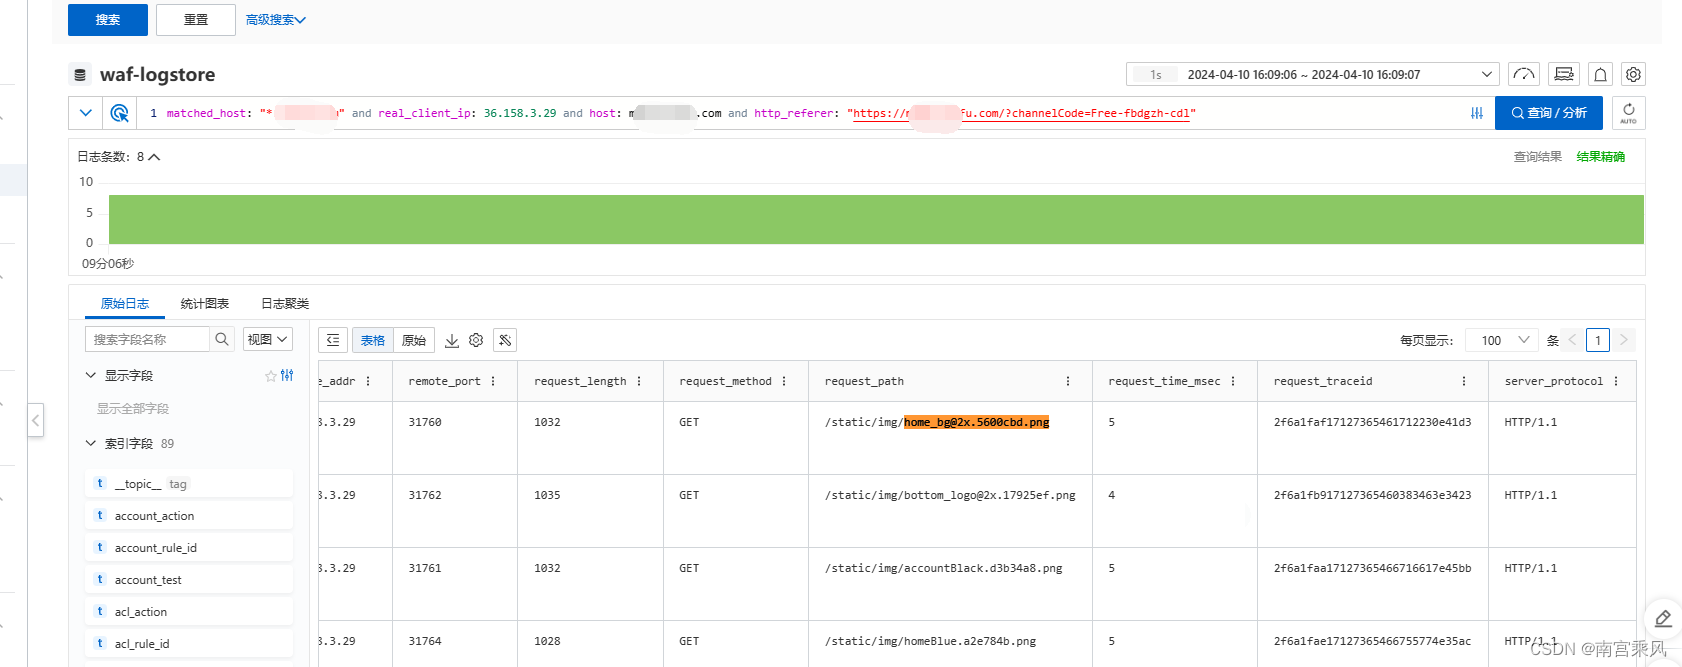
总结:阿里云的WAF日志更加详细,Nginx层面的日志也是WAF过来的(数据一样的)
下方三个截图的数据日志,就是一条的请求的访问。数据都是一样的,各个层面都有日志记录。毫无疑问 WAF更加专业 ,图像化更多。
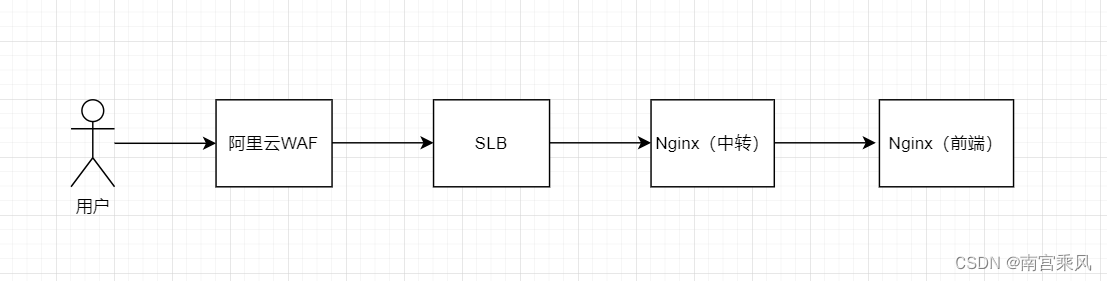
阿里云的WAF
Nginx中转
server {
        listen       80;
        server_name  bd.xxx.com ;
	rewrite ^/(.*)$ https://$host/$1 permanent;
}
server {
        listen       443 ssl;
        server_name  bd.xxx.com;
        ssl                   on;
        ssl_certificate      /usr/local/openresty/nginx/ssl/xx.com.crt;
        ssl_certificate_key  /usr/local/openresty/nginx/ssl/xxx.com.key;
        include ssl.conf;

        location / {
                proxy_pass  http://172.18.199.115:8085;
                include https_proxy.conf;
        }
}

Nginx前端
前端机器:172.18.199.115
server {
    listen       8085;
    server_name  bd.xxxx.com;
    root   /opt/mfbd/dist;
    index  index.html index.htm;

    location / {
        try_files $uri /index.html;
        add_header Access-Control-Allow-Origin *;
        add_header Access-Control-Allow-Headers Content-Type;
        add_header Access-Control-Allow-Methods GET,POST,OPTIONS;
        add_header Access-Control-Allow-Credentials true;
    }
}


日志分析与可视化
利用自定义日志数据进行日志分析与可视化是提高安全性和响应能力的关键。通过集成SIEM工具、ELK栈(Elasticsearch、Logstash、Kibana)或其他日志分析平台,可以对日志数据进行实时监控、异常检测和攻击行为分析。这些工具能够帮助团队快速识别并响应安全威胁,同时提供直观的数据可视化,以便深入理解和改进安全策略。
综上所述,WAF与Nginx前端代理的整合不仅加强了Web应用的安全层,而且通过有效的日志追踪和分析,为团队提供了关键的洞察,以持续改进安全姿态和响应能力。
参考文档:
https://www.cnblogs.com/ouym/p/15393191.html
https://www.iminling.com/2023/10/04/272.html
https://opswill.com/articles/nginx-custom-access-log-format.html