Grafana 监控 TDengine集群有两种方式:
一、 taosKeeper监控
TDengine 通过 taosKeeper 将服务器的 CPU、内存、硬盘空间、带宽、请求数、磁盘读写速度等信息定时写入指定数据库。TDengine 还将重要的系统操作(比如登录、创建、删除数据库等)日志以及各种错误报警信息进行记录。系统管理员可以从 CLI 直接查看这个数据库,也可以在 WEB 通过图形化界面查看这些监测信息。
具体可以参考官网的资料。
https://docs.taosdata.com/reference/taosKeeper/
本文就不讲解具体配置了
直接上干货 - 博主是k8s部署的
tdengine.yaml
---
apiVersion: apps/v1
kind: StatefulSet
metadata:
  name: "tdengine"
  namespace: "tdengine-test"
  labels:
    app: "tdengine"
spec:
  serviceName: "taosd"
  replicas: 3
  updateStrategy:
    type: RollingUpdate
  selector:
    matchLabels:
      app: "tdengine"
  template:
    metadata:
      name: "tdengine"
      labels:
        app: "tdengine"
    spec:
      containers:
        - name: "tdengine"
          image: "tdengine/tdengine:3.0.7.1"
          imagePullPolicy: "IfNotPresent"
          ports:
            - name: tcp6030
              protocol: "TCP"
              containerPort: 6030
            - name: tcp6041
              protocol: "TCP"
              containerPort: 6041
            - name: tcp6043
              protocol: "TCP"
              containerPort: 6043
          env:
            # POD_NAME for FQDN config
            - name: POD_NAME
              valueFrom:
                fieldRef:
                  fieldPath: metadata.name
            # SERVICE_NAME and NAMESPACE for fqdn resolve
            - name: SERVICE_NAME
              value: "taosd"
            - name: STS_NAME
              value: "tdengine"
            - name: STS_NAMESPACE
              valueFrom:
                fieldRef:
                  fieldPath: metadata.namespace
            # TZ for timezone settings, we recommend to always set it.
            - name: TZ
              value: "Asia/Shanghai"
            # Environment variables with prefix TAOS_ will be parsed and converted into corresponding parameter in taos.cfg. For example, serverPort in taos.cfg should be configured by TAOS_SERVER_PORT when using K8S to deploy
            - name: TAOS_SERVER_PORT
              value: "6030"
            # Must set if you want a cluster.
            - name: TAOS_FIRST_EP
              value: "$(STS_NAME)-0.$(SERVICE_NAME).$(STS_NAMESPACE).svc.cluster.local:$(TAOS_SERVER_PORT)"
            # TAOS_FQND should always be set in k8s env.
            - name: TAOS_FQDN
              value: "$(POD_NAME).$(SERVICE_NAME).$(STS_NAMESPACE).svc.cluster.local"
          volumeMounts:
            - name: taosdata
              mountPath: /var/lib/taos
            - name: taoscfg
              mountPath: /etc/taos/taos.cfg
              subPath: taos.cfg
          startupProbe:
            exec:
              command:
                - taos-check
            failureThreshold: 360
            periodSeconds: 10
          readinessProbe:
            exec:
              command:
                - taos-check
            initialDelaySeconds: 5
            timeoutSeconds: 5000
          livenessProbe:
            exec:
              command:
                - taos-check
            initialDelaySeconds: 15
            periodSeconds: 20
      volumes:
      - name: taoscfg
        configMap:
          name: taoscfg
  volumeClaimTemplates:
    - metadata:
        name: taosdata
      spec:
        accessModes:
          - "ReadWriteOnce"
        storageClassName: "nfs-client"
        resources:
          requests:
            storage: "5Gi"
taosd-service.yaml
---
apiVersion: v1
kind: Service
metadata:
  name: "taosd"
  namespace: "tdengine-test"
  labels:
    app: "tdengine"
spec:
  ports:
    - name: tcp6030
      protocol: "TCP"
      port: 6030
      targetPort: tcp6030
      nodePort: 31030
    - name: tcp6041
      protocol: "TCP"
      port: 6041
      targetPort: tcp6041
      nodePort: 31041
    - name: tcp6043
      protocol: "TCP"
      port: 6043
      targetPort: tcp6043
      nodePort: 31043
  type: NodePort
  selector:
    app: "tdengine"
vi taos.cfg
monitor 1
monitorFqdn localhost
kubectl create cm --from-file=taos.cfg -n tdengine-test taoscfg
直接apply ,之后在容器内直接执行taoskeeper命令
curl http://127.0.0.1:6043/metrics
执行后看看有没有数据
有的话去配置Prometheus
scrape_configs:
  - job_name: "taoskeeper"
    # metrics_path defaults to '/metrics'
    # scheme defaults to 'http'.
    static_configs:
      - targets: ["localhost:6043"]
配置完重启就可以在Prometheus看到数据了
Prometheus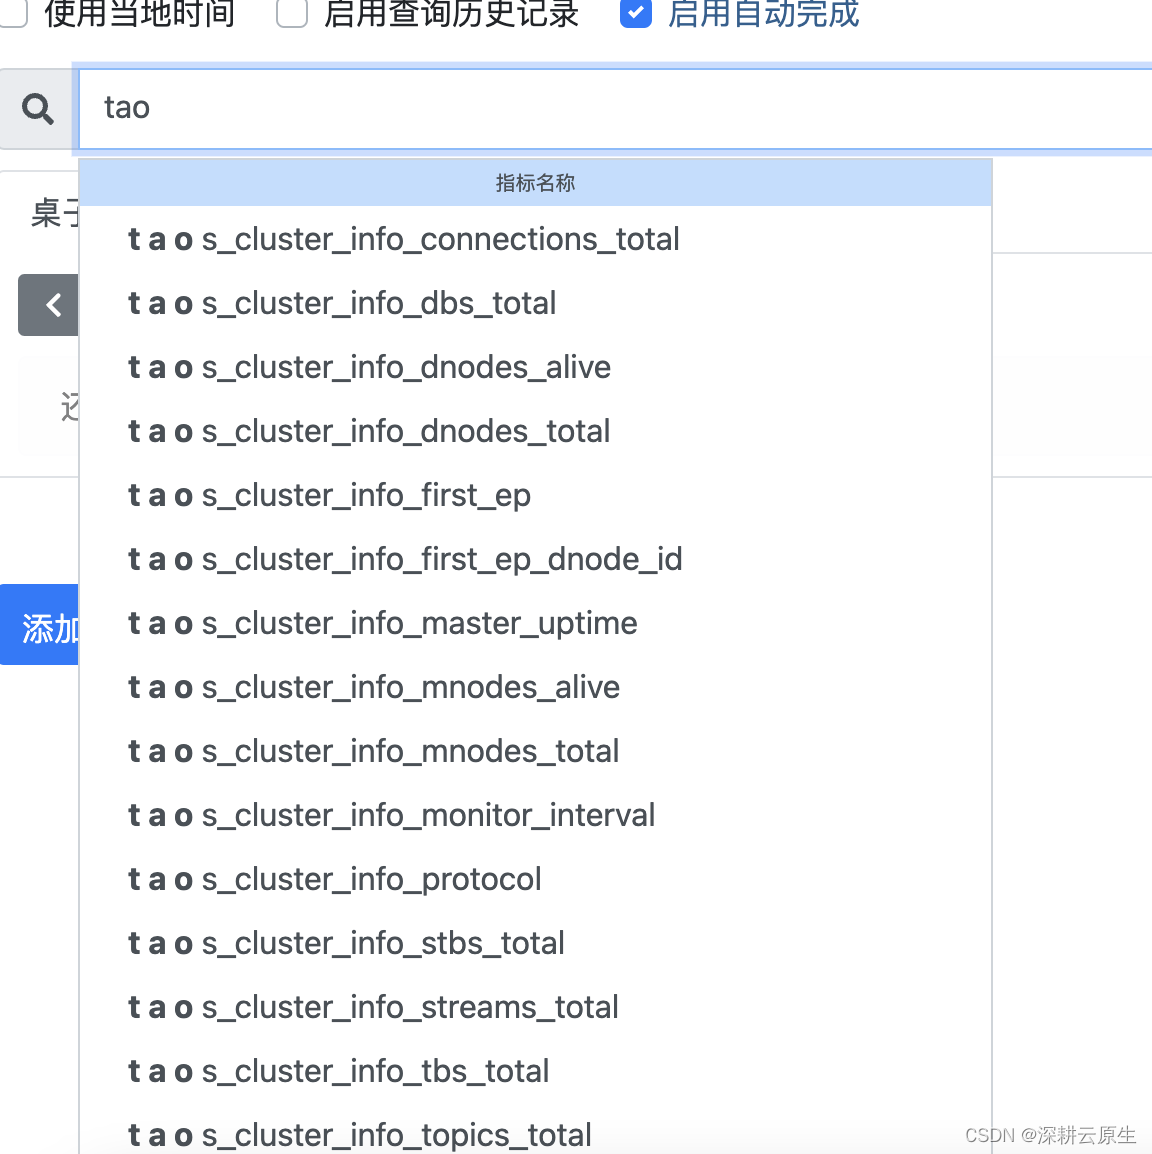
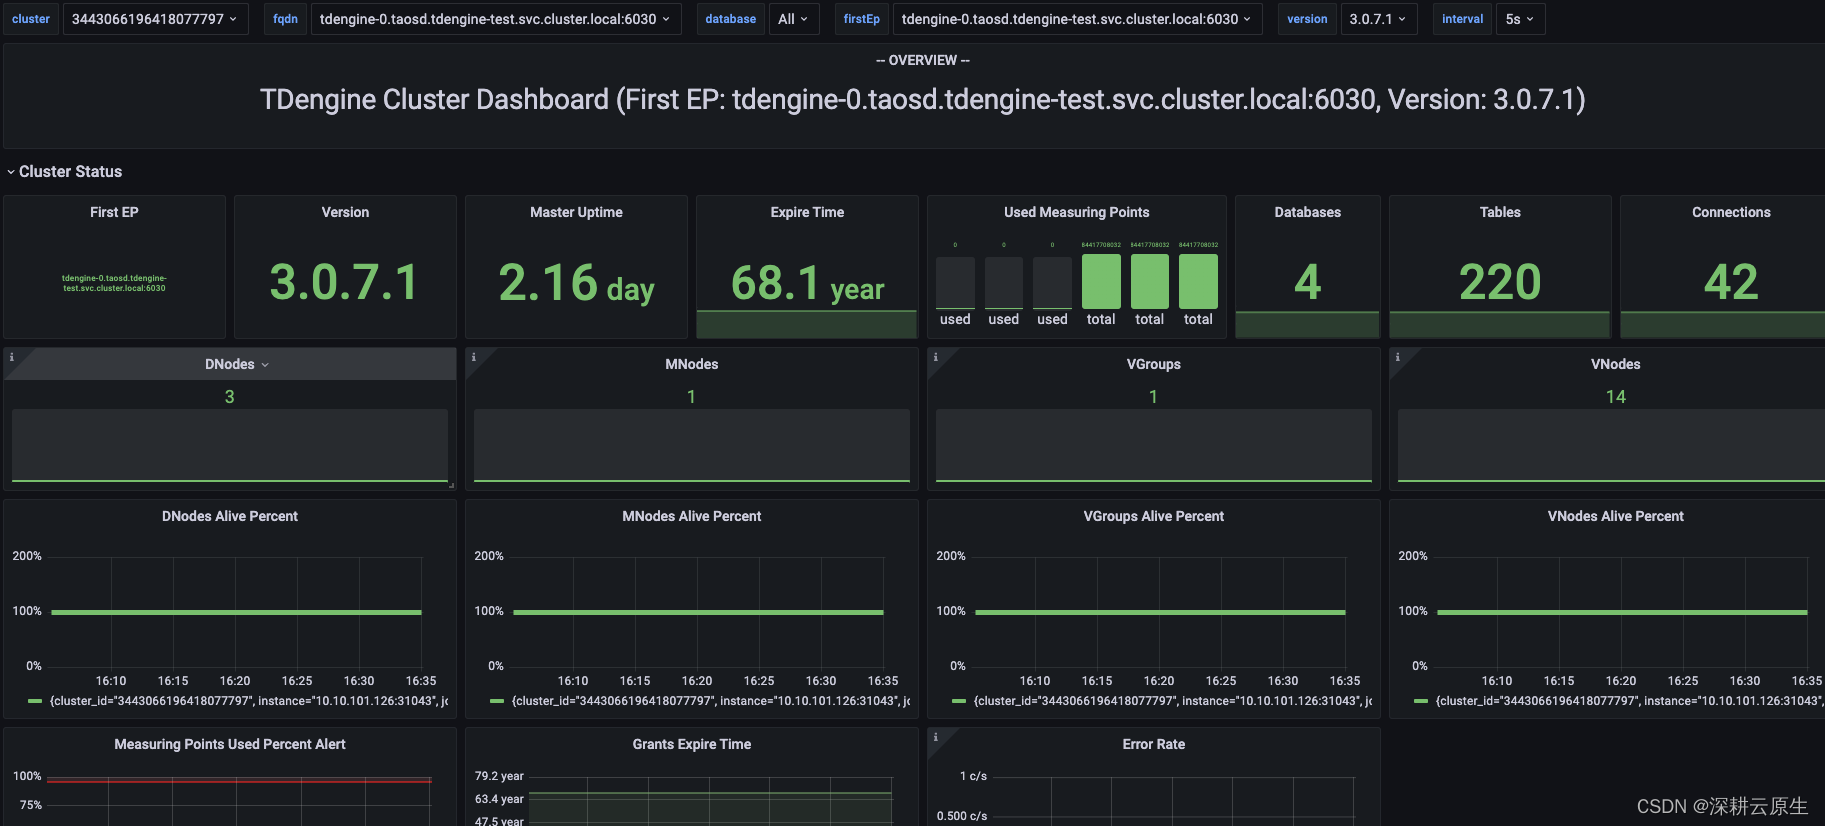
Dashboard
官网提供了 TaosKeeper Prometheus Dashboard for 3.x dashboard,提供了和 TDinsight 类似的监控 dashboard。
https://grafana.com/grafana/dashboards/18587-taoskeeper-prometheus-dashboard-for-3-x/
下载后导入就好了
二、安装 TDengine 的 Grafana 插件,监控TDengine
这里直接看我上个文章,博主就不重复工作了
直通车