Pyvista是一个用于科学可视化和分析的Python库 ;我认为它适合做一些网格数据的处理;
它封装了VTK(Visualization Toolkit)之上,提供了一些高级接口, 3D数据可视化变得更加简单和易用。


1.安装 pyvista:
使用以下命令安装 pyvista:
pip install pyvista
2.使用:
pyvista: 导入 pyvista 库来开始使用它:
import pyvista as pv3.样例:
画一个3D 小球
import pyvista as pv

sphere = pv.Sphere()


pl = pv.Plotter()
pl.add_mesh(sphere, style='wireframe', color='k', line_width=2)

pl.show()
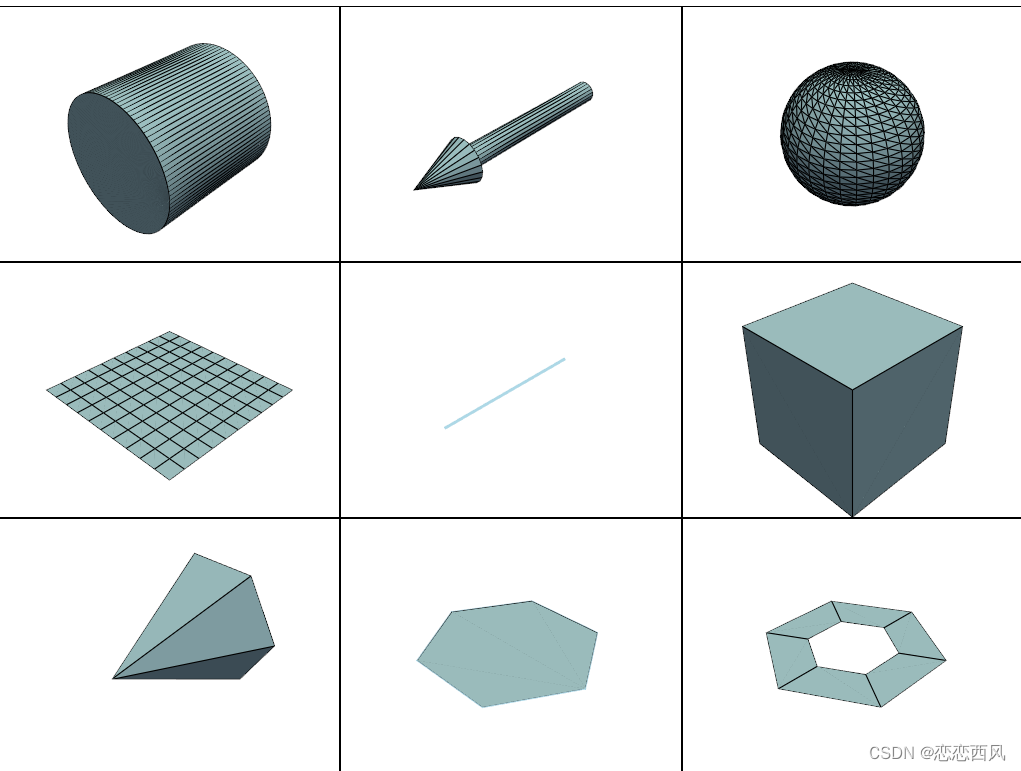
4. 普通几何对象 Geometric Objects
import pyvista as pv


cyl = pv.Cylinder()
arrow = pv.Arrow()
sphere = pv.Sphere()
plane = pv.Plane()
line = pv.Line()
box = pv.Box()
cone = pv.Cone()
poly = pv.Polygon()
disc = pv.Disc()

p = pv.Plotter(shape=(3, 3))
# Top row
p.subplot(0, 0)
p.add_mesh(cyl, color='lightblue', show_edges=True)
p.subplot(0, 1)
p.add_mesh(arrow, color='lightblue', show_edges=True)
p.subplot(0, 2)
p.add_mesh(sphere, color='lightblue', show_edges=True)
# Middle row
p.subplot(1, 0)
p.add_mesh(plane, color='lightblue', show_edges=True)
p.subplot(1, 1)
p.add_mesh(line, color='lightblue', line_width=3)
p.subplot(1, 2)
p.add_mesh(box, color='lightblue', show_edges=True)
# Bottom row
p.subplot(2, 0)
p.add_mesh(cone, color='lightblue', show_edges=True)
p.subplot(2, 1)
p.add_mesh(poly, color='lightblue', show_edges=True)
p.subplot(2, 2)
p.add_mesh(disc, color='lightblue', show_edges=True)
# Render all of them
p.show()