1、概述
Spring Boot Admin 是一款用于监控 Spring Boot 应用程序的开源工具,可帮助开发者实时监控应用的运行状态、性能指标、日志信息等。
2、核心功能
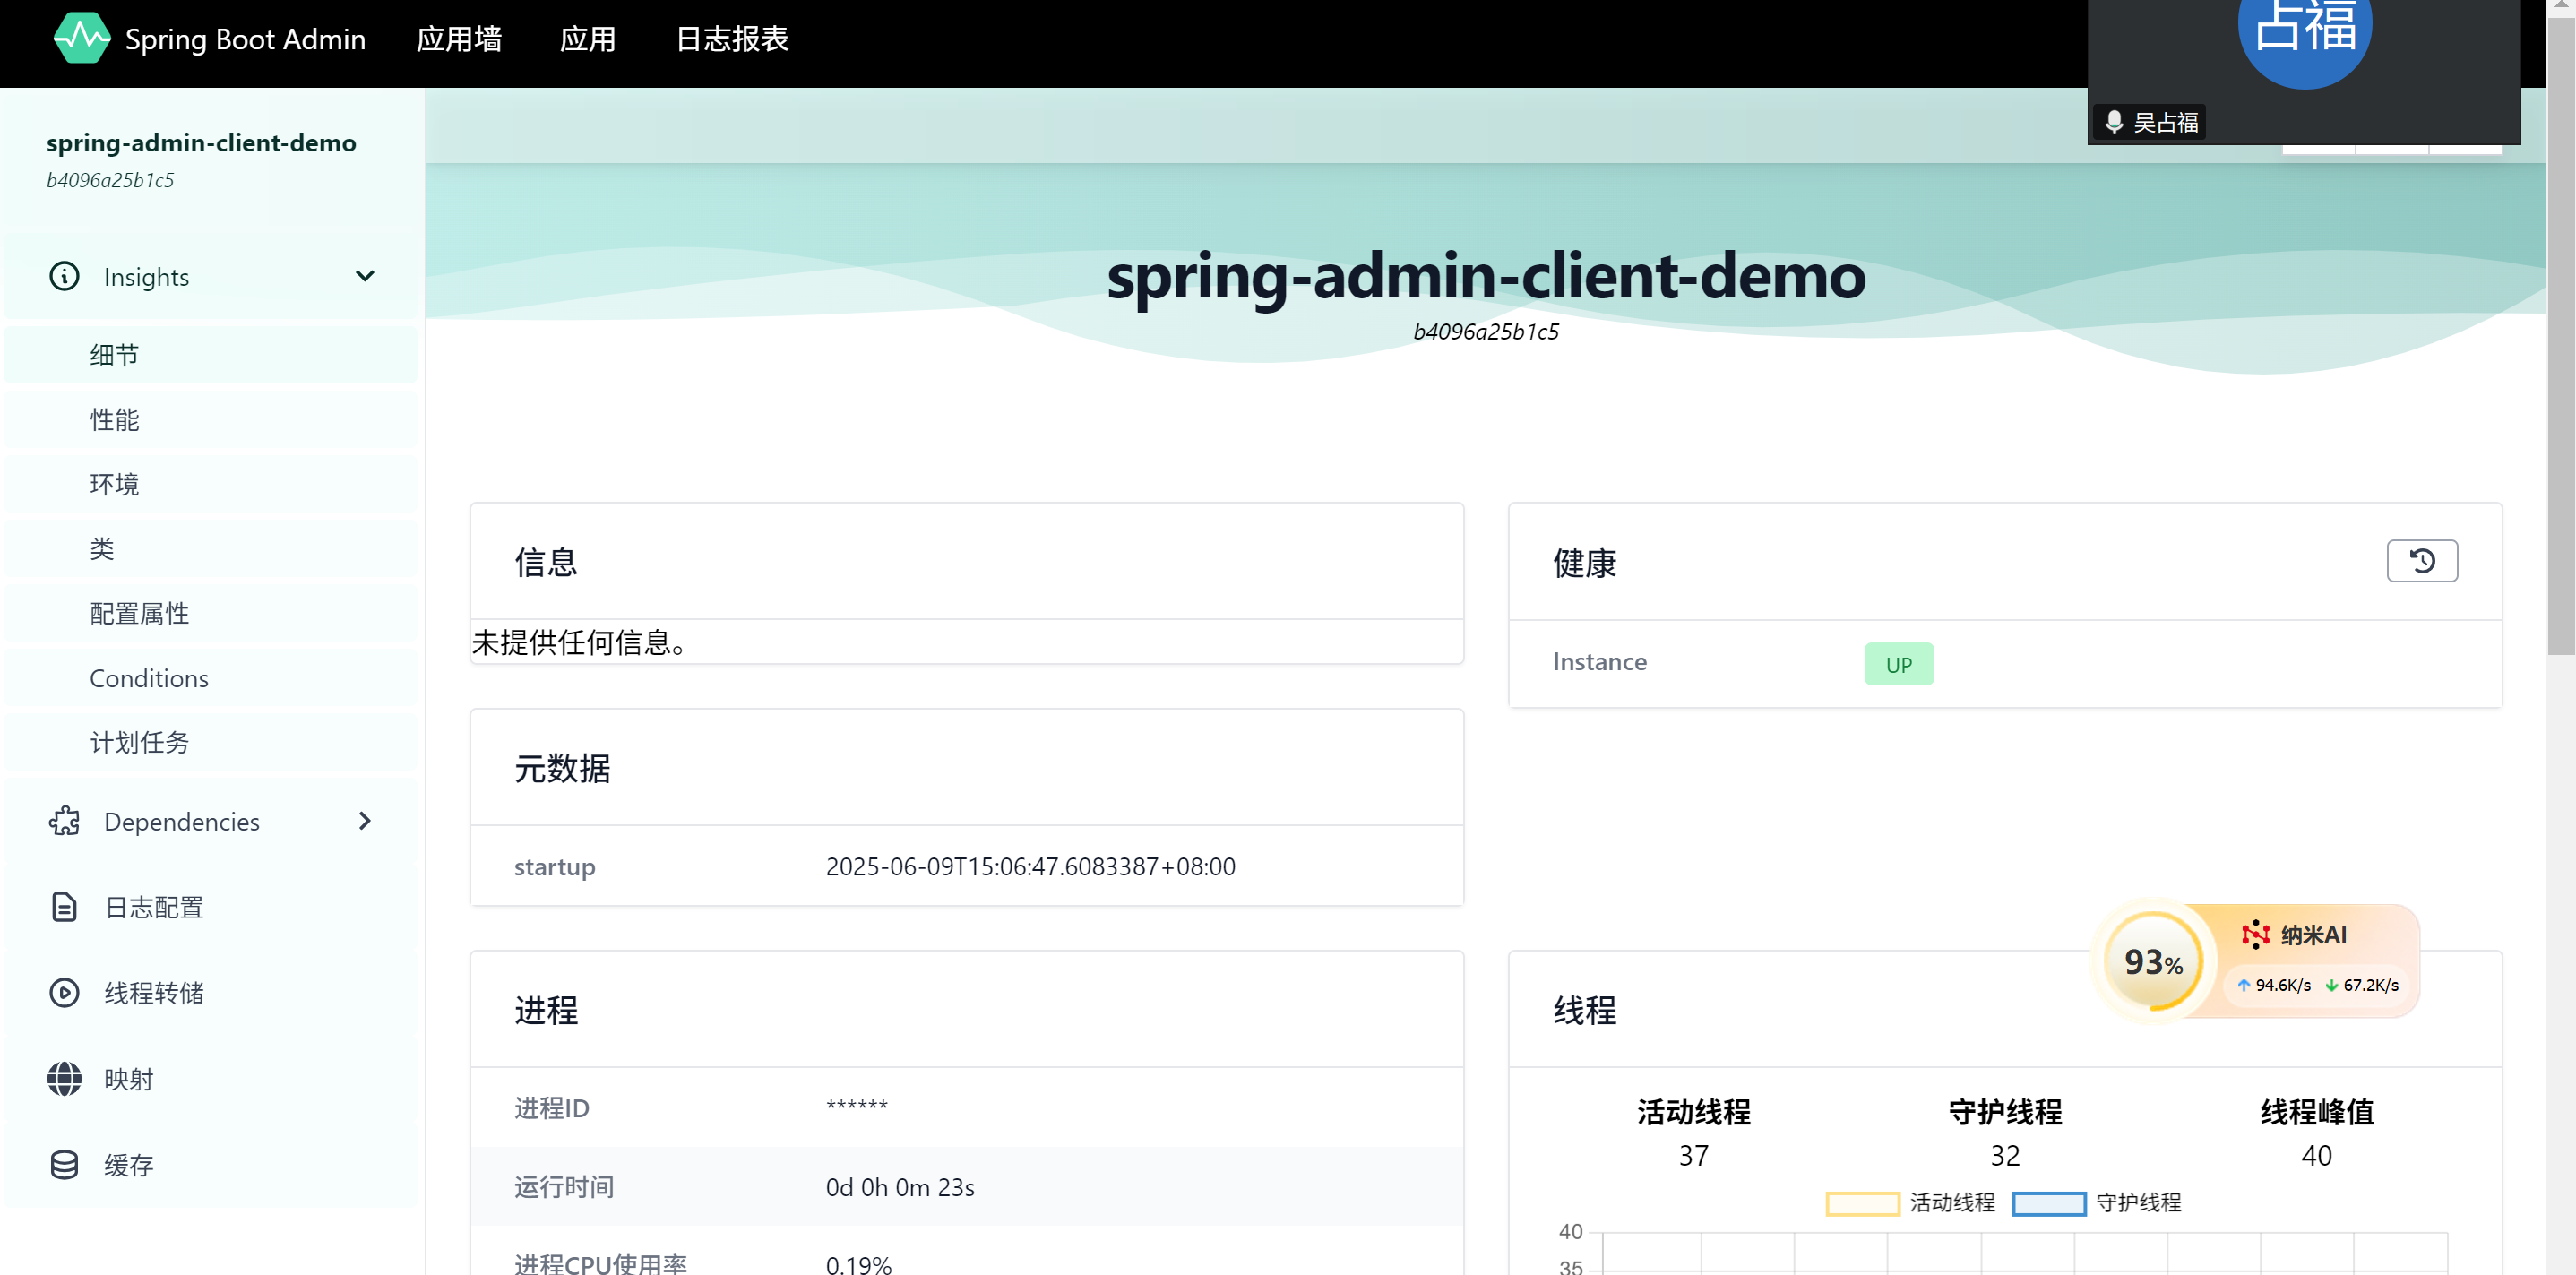
应用状态监控
- 显示应用是否在线、启动时间、运行时长等基础信息。
- 监控 JVM 相关指标:内存使用情况(堆内存、非堆内存)、线程状态(活跃线程数、峰值线程数)、类加载数量等。
- 查看 CPU 使用率、垃圾回收(GC)频率及耗时。
应用详情查看
- 展示应用的配置属性(如
application.properties中的参数)。 - 查看 HTTP 端点(Endpoints)信息,如健康检查(
/health)、环境变量(/env)、日志级别(/loggers)等。
日志管理
- 实时查看和修改应用的日志级别(如 DEBUG、INFO、WARN)。
- 支持按条件过滤日志内容。
告警与通知
- 结合第三方工具(如 Email、Slack、钉钉等)实现告警通知,当应用状态异常或指标超出阈值时触发提醒。
批量监控
- 支持同时监控多个 Spring Boot 应用,通过统一的 Web 界面集中管理。
3、搭建监控系统
配置监控端(Admin Server)
添加依赖
在 pom.xml 中引入 Spring Boot Admin Server:
<dependency>
    <groupId>de.codecentric</groupId>
    <artifactId>spring-boot-admin-starter-server</artifactId>
</dependency>
启用 Admin Server
在主类上添加 @EnableAdminServer 注解:
package com.ybw;

import de.codecentric.boot.admin.server.config.EnableAdminServer;
import org.springframework.boot.SpringApplication;
import org.springframework.boot.autoconfigure.SpringBootApplication;

/**
 * 启动类
 *
 * @author ybw
 * @version V1.0
 * @className SpringAdminServerDemoApplication
 * @date 2025/6/9
 **/
@SpringBootApplication
@EnableAdminServer
public class SpringAdminServerDemoApplication {

    public static void main(String[] args) {
        SpringApplication.run(SpringAdminServerDemoApplication.class, args);
    }

}
配置端口和安全(可选)
server.port=9090  # 监控端端口
spring.security.user.name=admin  # 认证用户名
spring.security.user.password=123456  # 认证密码
配置被监控应用(Admin Client)
添加依赖
在被监控应用的 pom.xml 中引入 Spring Boot Admin Client:
<dependency>
    <groupId>de.codecentric</groupId>
    <artifactId>spring-boot-admin-starter-client</artifactId>
</dependency>
配置监控端地址
在被监控应用的 application.properties 中指定监控端的 URL:
spring.boot.admin.client.url=http://localhost:9090  # 监控端地址
management.endpoints.web.exposure.include=*  # 暴露所有监控端点
启动并访问监控界面
先启动监控端(Admin Server),访问 http://localhost:9090,输入认证信息(若配置了安全策略)。
4、扩展功能与最佳实践
自定义监控指标
通过 Spring Boot 的 Micrometer 框架添加自定义指标(如数据库连接数、业务接口响应时间):
import io.micrometer.core.annotation.Timed;
import org.springframework.web.bind.annotation.GetMapping;
import org.springframework.web.bind.annotation.RestController;

@RestController
public class CustomMetricsController {
    @Timed(value = "api.request.time", description = "请求处理耗时")
    @GetMapping("/custom-api")
    public String customApi() {
        // 业务逻辑
        return "Hello, Admin!";
    }
}- 写在被监控端:admin client。
告警集成
使用 Spring Boot Admin 的 Notifier 接口集成告警服务,例如通过邮件通知:
import de.codecentric.boot.admin.server.notify.AbstractEventNotifier;
import de.codecentric.boot.admin.server.notify.StatusChangeEvent;
import org.springframework.stereotype.Component;

@Component
public class EmailNotifier extends AbstractEventNotifier {
    @Override
    protected void doNotify(StatusChangeEvent event) {
        // 发送邮件逻辑(调用邮件服务 API)
        String message = String.format("应用 %s 状态变更为 %s", event.getApplication().getName(), event.getStatusInfo());
        sendEmail("admin@example.com", "Spring Boot Admin 告警", message);
    }

    private void sendEmail(String to, String subject, String content) {
        // 具体邮件发送实现
    }
}- 写在监控端:admin server。
- 触发条件:基于状态变化触发,默认情况下,Spring Boot Admin 会在应用状态发生变化时触发告警(如
UP→DOWN、OFFLINE→UP等)。常见状态如下:UP:应用正常运行DOWN:应用健康检查失败OFFLINE:应用注册后断开连接UNKNOWN:状态未知
5、常用端点(Endpoints)
Spring Boot Admin 通过访问应用的监控端点获取数据,常用端点如下:
| 端点路径 | 描述 |
|---|---|
/health |
健康检查状态(是否存活) |
/info |
应用信息(如版本、构建时间) |
/metrics |
指标数据(JVM、CPU、自定义指标) |
/loggers |
日志级别管理 |
/env |
环境变量和配置属性 |
/threaddump |
线程 dump 信息 |
6、持久化
默认内存存储(无持久化)
Spring Boot Admin 默认使用内存存储监控数据,这意味着:
- 数据生命周期:监控数据仅在 Admin Server 运行期间有效,重启后数据丢失。
- 短期数据:默认只保留最近的状态变化和指标,例如:
- 应用状态(UP/DOWN):仅保留最新状态。
- 指标数据(堆内存、线程数):仅保留最近几次采样值(通常为几分钟内)。