本章内容如下:
Prometheus 介绍
Prometheus 部署和配置
Node Exporter 采集数据
Pushgateway 采集数据
PromQL 查询语言
Grafana 图形化展示
Prometheus 标签管理
Prometheus 告警机制
Prometheus 服务发现
各种 Exporter 高级功能
Prometheus 实现容器监控
Prometheus 联邦 Federation
Prometheus 远程存储 VictoriaMetrics
Kubernetes 集成 Prometheus
1.Prometheus 介绍
官方文档:
https://prometheus.io/docs/
https: //prometheus.io/docs/introduction/overview/
Prometheus 的主要模块包括:
●prometheus 时序数据存储、监控指标管理
●可视化
Prometheus web UI : 集群状态管理、 promQL
Grafana: 非常全面的可视化套件
●数据采集
Exporter: 为当前的客户端暴露出符合 Prometheus 规格的数据指标 ,Exporter 以守护进程的模式运行井开始采集数据,Exporter 本身也是一个 http_server 可以对 http 请求作出响应返回数据 (K/V 形式的metrics)
Pushgateway : 拉模式下数据的采集工具
●监控目标 服务发现 : 文件方式、 dns 方式、 console 方式、 k8s 方式
●告警: alertmanager
Prometheus 由几个主要的软件组件组成,其职责概述如下:
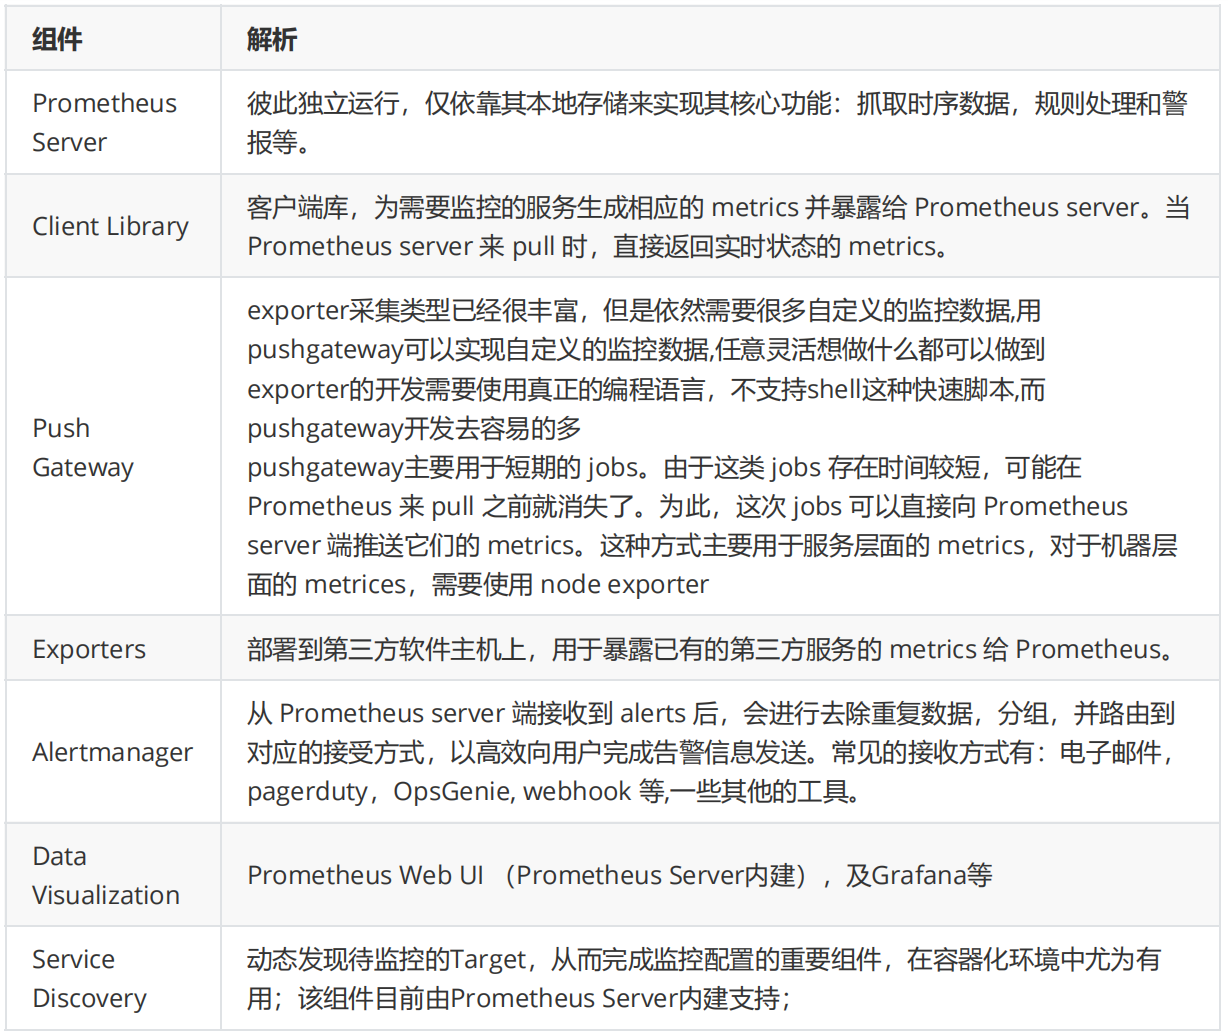
工作流程
●Prometheus server 定期从配置好的 jobs 或者 exporters 中拉取 Pull metrics ,或者接收来自
Pushgateway 发过来的 metrics ,或者从其他的 Prometheus server 中拉 metrics 。
●Prometheus server 在本地存储收集到的 metrics ,并运行已定义好的 alert rules ,记录新的时间 序列或者向 Alertmanager 推送警报,实现一定程度上的完全冗余功能。
●Alertmanager 根据配置文件,对接收到的警报进行去重分组,根据路由配置,向对应主机发出 告警。
●集成Grafana 或其他 API 作为图形界面,用于可视化收集的数据。
Prometheus 只负责时序型指标数据的采集及存储
2.Prometheus 部署和配置
①ubuntu包安装
apt install prometheus 其他安装略
# 访问如下链接可以看到如下显示
http://<prometheus 服务器 IP>:9090
# 浏览器访问prometheus的指标 :
http://<prometheus 服务器 IP>:9090/metrics
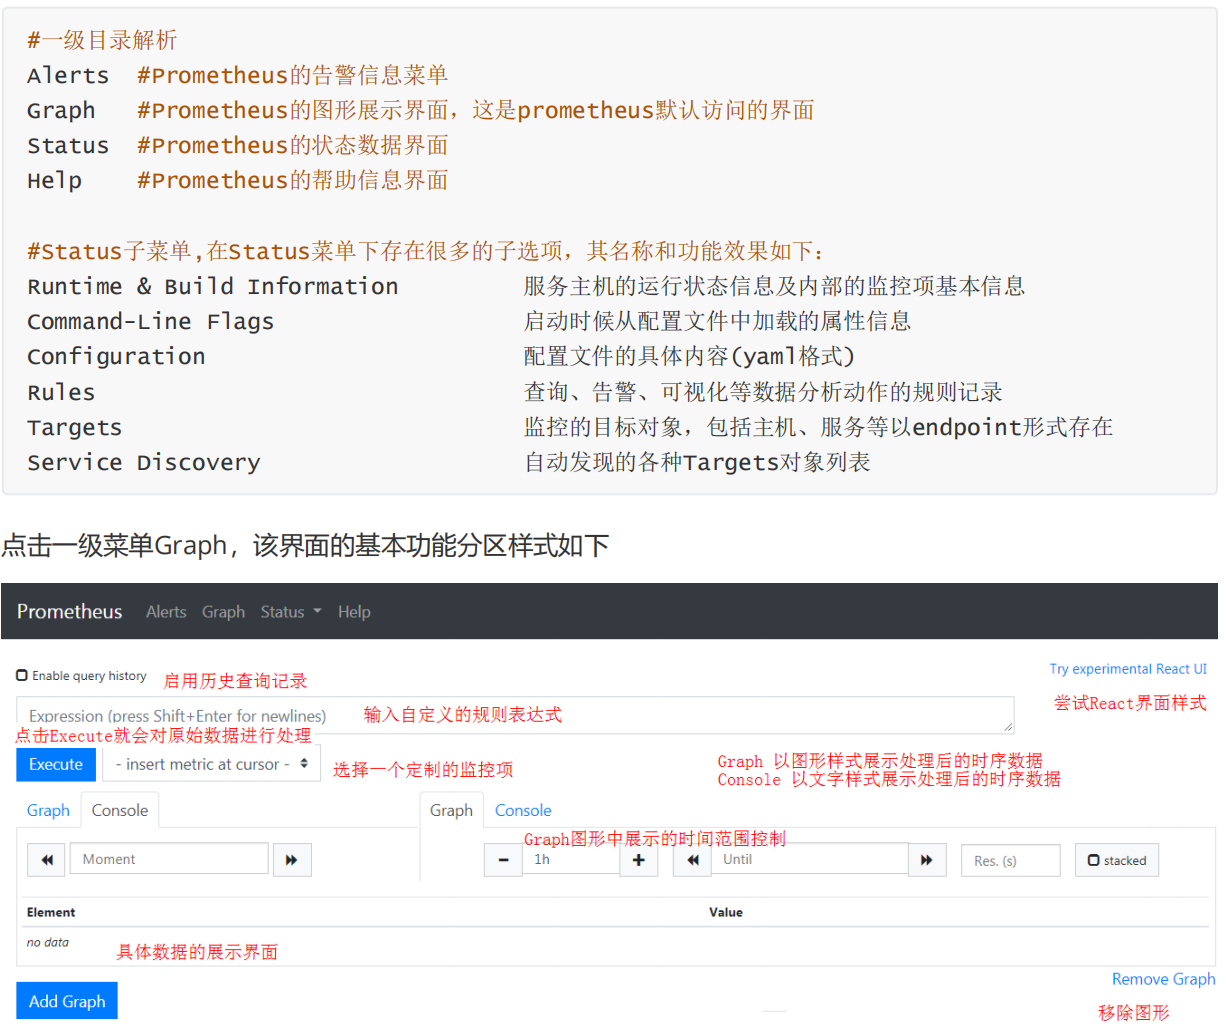
Dashboard 菜单说明
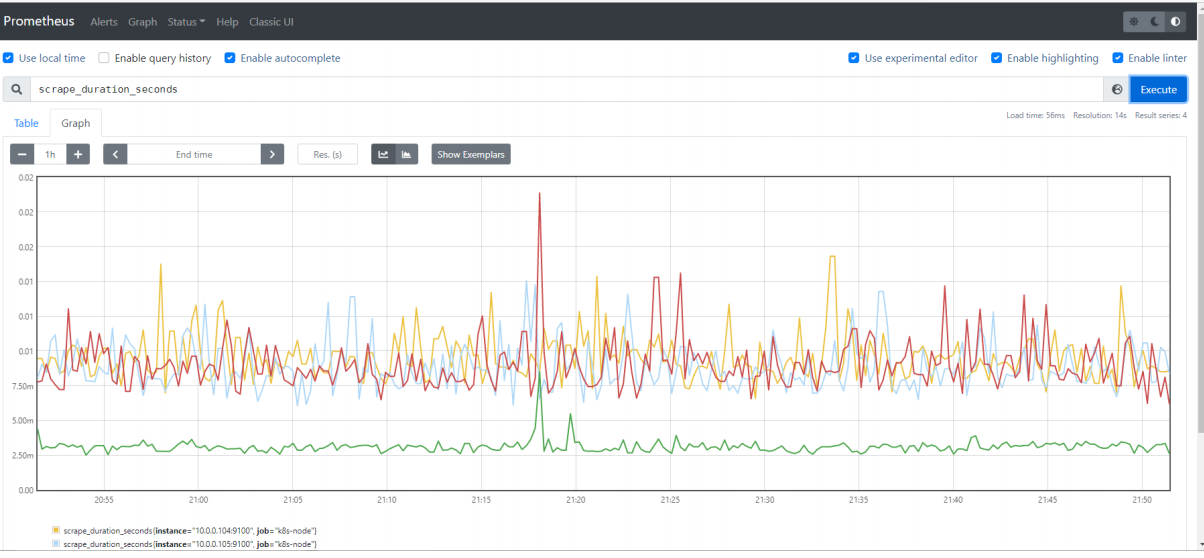
我们选择一个监控项"scrape_duration_seconds",然后点击"Execute",查看效果
查看所有的监控项: 10.0.0.203:9090/api/v1/label/__name__/values
API访问
https://prometheus.io/docs/prometheus/latest/management_api/
https://prometheus.io/docs/prometheus/latest/querying/api/
注意: {ip:port} 是 Prometheus 所在的 IP 和端口
●健康检查 GET {ip:port}/-/healthy 该端点始终返回200 ,应用于检查 Prometheus 的运行状况。
●准备检查 GET {ip:port}/-/ready 当Prometheus 准备服务流量(即响应查询)时,此端点返回 200 。
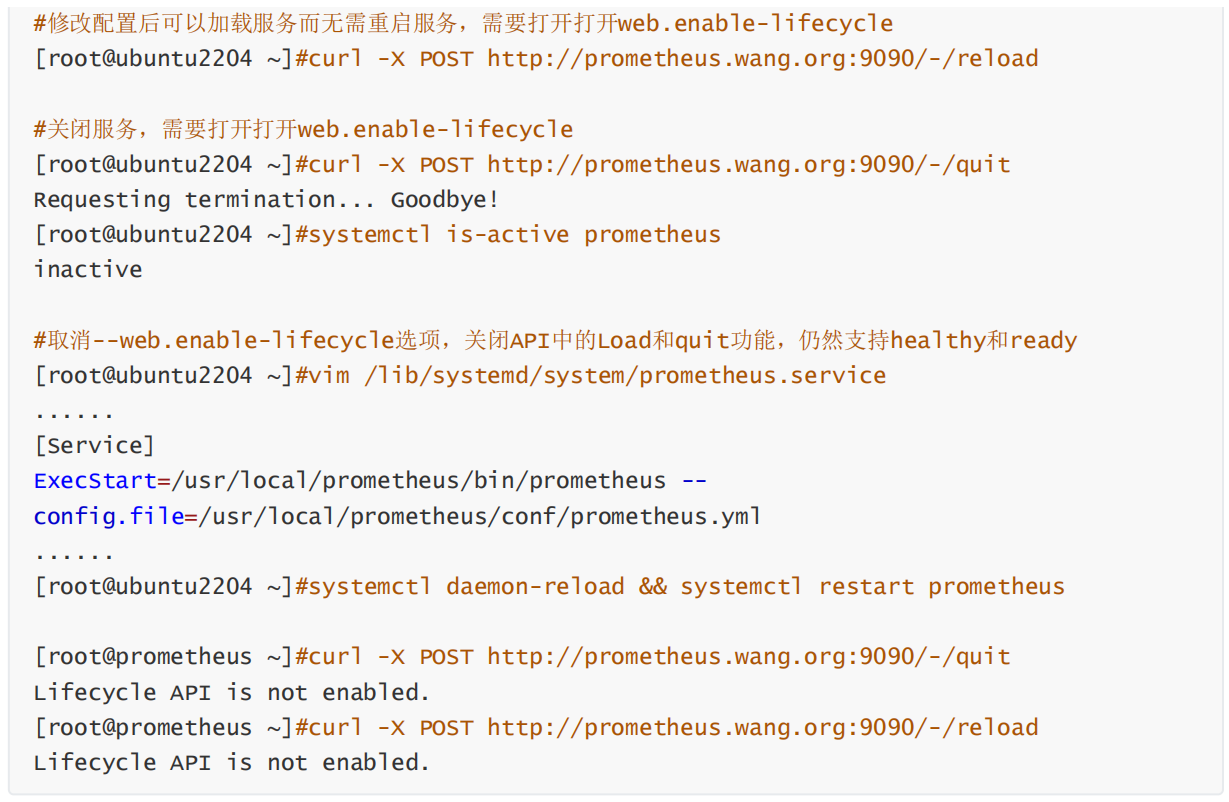
●加载配置 PUT {ip:port}/-/reload POST {ip:port}/-/reload
●关闭服务 PUT {ip:port}/-/quit POST {ip:port}/-/quit
[root@ubuntu2204 ~] #cat /lib/systemd/system/prometheus.service
......
......
[Service]
ExecStart = /usr/local/prometheus/bin/prometheus --
config .file = /usr/local/prometheus/conf/prometheus.yml --web .enable-lifecycle
......
[root@ubuntu2204 ~] #curl http://prometheus.wang.org:9090/-/healthy
[root@ubuntu2204 ~] #curl http://prometheus.wang.org:9090/-/ready
优化配置
Prometheus 命令支持选项如下:
https://prometheus.io/docs/prometheus/latest/command-line/prometheus/
②Node Exporter 安装
安装 Node Exporter 用于收集各 node 主机节点上的监控指标数据,监听端口为 9100
github 链接 https://github.com/prometheus/node_exporter
官方下载 https://prometheus.io/download/
在需要监控的所有节点主机上进行安装
[root@node1 ~]#wget -P /usr/local/
https://github.com/prometheus/node_exporter/releases/download/v1.2.2/node_exporter-
1.2.2.linux-amd64.tar.gz
[root@node1 ~]#cd /usr/local
[root@node1 local]#tar xvf node_exporter-1.2.2.linux-amd64.tar.gz
[root@node1 local]#ln -s node_exporter-1.2.2.linux-amd64 node_exporter
[root@node1 local]#cd node_exporter
[root@node1 node_exporter]#mkdir bin
[root@node1 node_exporter]#mv node_exporter bin/
[root@node1 ~]#useradd -r -s /sbin/nologin prometheus
[root@node1 ~]#chown -R prometheus:prometheus /usr/local/node_exporter/