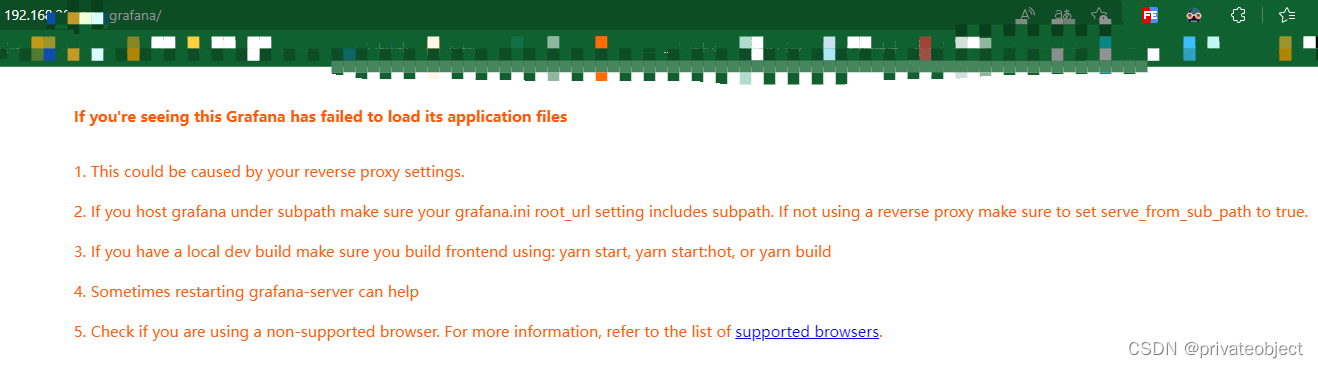
在学习开源监控prometheus和grafana的时候,通过nginx代理无法访问grafana问题记录。在调整grafana的ini文件后,直连grafana是没问题,通过nginx代理访问页面报错如下。
If you’re seeing this Grafana has failed to load its application files
- This could be caused by your reverse proxy settings.
- If you host grafana under subpath make sure your grafana.ini root_url setting includes subpath. If not using a reverse proxy make sure to set serve_from_sub_path to true.
- If you have a local dev build make sure you build frontend using: yarn start, yarn start:hot, or yarn build
- Sometimes restarting grafana-server can help
- Check if you are using a non-supported browser. For more information, refer to the list of supported browsers.
参考
Prometheus、Grafana安装-部署-nginx代理-监控linux
解决Nginx遇到206问题
Nginx时js加载报206 (Partial Content)及ERR_CONTENT_LENGTH_MISMATCH
nginx 缓冲区设置 proxy_buffers
代理后无法打开grafana页面
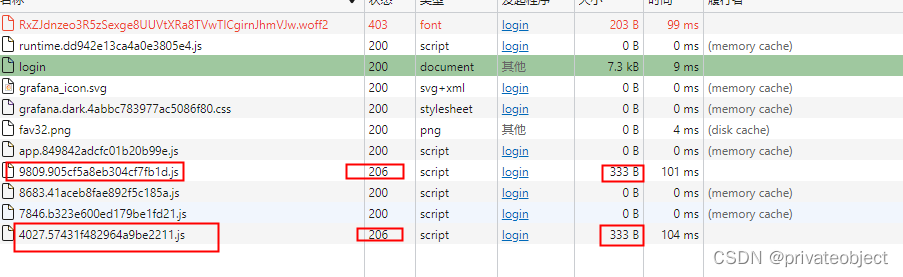
无论怎么刷新都是这个页面
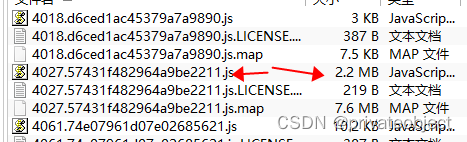
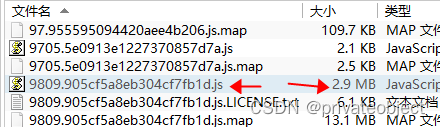
通过分析发现有两个js无论怎么刷新都加载不到,服务器上这两个js是存在的/usr/share/grafana/public/build,并且都是大于2M的文件,合理怀疑是nginx配置问题。通过百度搜索发现可能是nginx的代理缓存不足的问题。

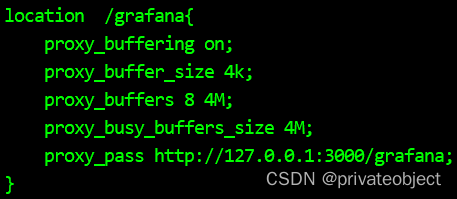
nginx代理配置改为
location  /grafana{
    proxy_buffering on;
    proxy_buffer_size 4k;
    proxy_buffers 8 4M;
    proxy_busy_buffers_size 4M;
    proxy_pass http://127.0.0.1:3000/grafana;
}
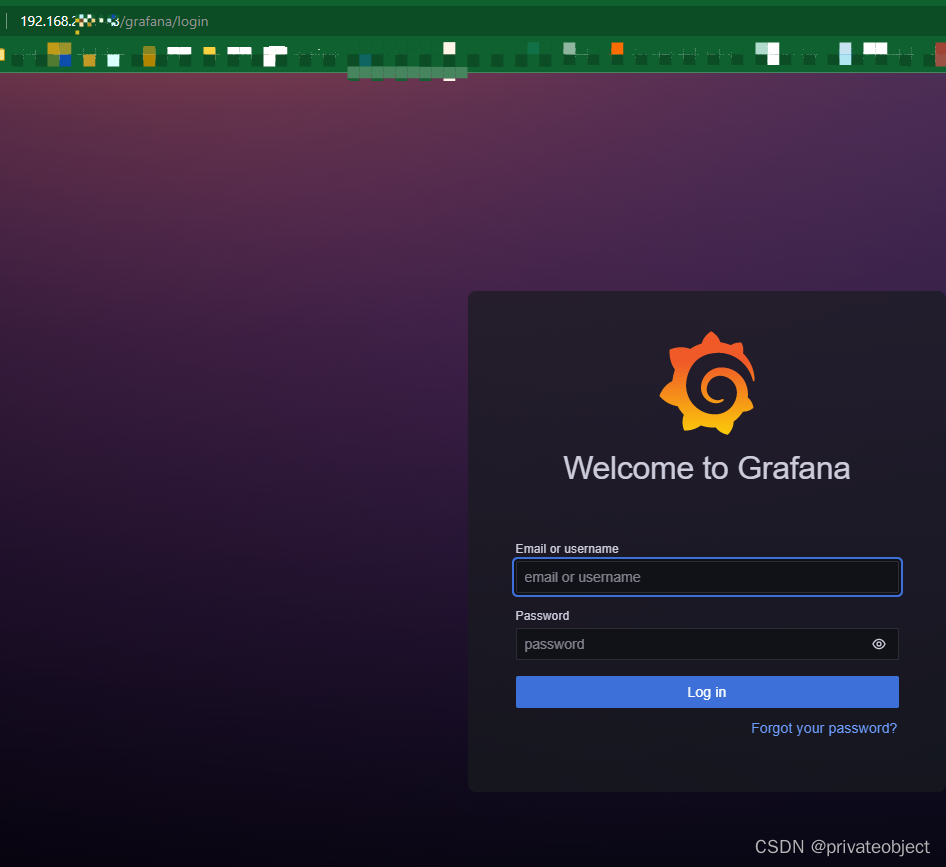
./nginx -s reload 重启nginx
再次访问页面,问题解决
本文含有隐藏内容,请 开通VIP 后查看