目录
findobj的功能是查找具有特定属性的图形对象。
语法
h = findobj
h = findobj(prop,value)
h = findobj('-not',prop,value)
h = findobj(prop1,value1,oper,prop2,value2)
h = findobj('-regexp',prop,expr)
h = findobj('-property',prop)
h = findobj(prop1,value1,...,propN,valueN)
h = findobj(objhandles,___)
h = findobj(objhandles,'-depth',d,___)
h = findobj(objhandles,'flat',___)
说明
h = findobj 返回图形根对象及其所有后代。
h = findobj(prop,value) 返回层次结构中属性 prop 设置为 value 的所有对象。
h = findobj('-not',prop,value) 返回其指定属性未设置为指定值的所有对象。
h = findobj(prop1,value1,oper,prop2,value2) 将逻辑运算符 oper 应用于 prop,value 对组。例如,h = findobj('LineStyle','--','-and','Marker','o') 返回具有虚线线型和圆形标记的所有对象。
h = findobj('-regexp',prop,expr) 使用正则表达式来查找具有特定属性值的对象。函数返回属性值满足正则表达式的对象。
h = findobj('-property',prop) 返回具有指定属性的所有对象。
h = findobj(prop1,value1,...,propN,valueN) 返回层次结构中指定属性设置为指定值的所有对象。您可以用上述语法中的其他输入参数组合替换 prop,value 对组。例如,h = findobj(prop1,value1,'-not',prop2,value2,'-property',prop3) 返回满足以下三个条件的所有对象:
该对象的属性 prop1 设置为 value1。
该对象的属性 prop2 的值未设置为 value2。
该对象具有属性 prop3。
h = findobj(objhandles,___) 将搜索范围限制为在 objhandles 中列出的对象及其所有后代。可以对任何上述语法限制搜索范围。
h = findobj(objhandles,'-depth',d,___) 将搜索范围限制为 objhandles 中列出的对象及其后代,它们在图形对象层次结构中位于 d 级别以下。
h = findobj(objhandles,'flat',___) 将搜索范围限制为仅 objhandles 中列出的对象。不搜索后代对象。使用 'flat' 选项等效于将 '-depth' 选项与 d = 0 结合使用。
示例
查找所有图形对象
删除所有现有图窗,然后创建一个随机值图。
close all
plot(rand(5))
如图所示:
返回图形根对象及其所有后代。
h = findobj
h =
  8x1 graphics array:

  Root
  Figure    (1)
  Axes
  Line
  Line
  Line
  Line
  Line
查找所有线条对象
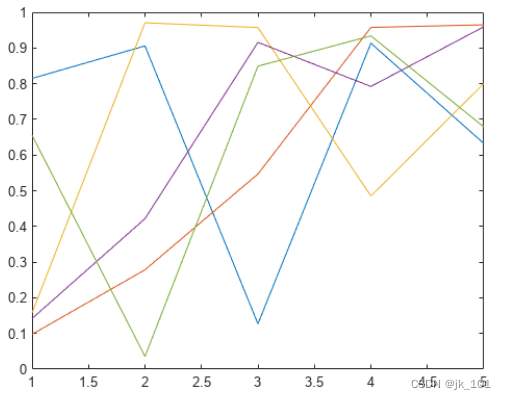
删除所有现有图窗,然后创建一个多线图。
close all
plot(magic(4))
如图所示:

返回所有线条对象。
h = findobj('Type','line')
h =
  4x1 Line array:

  Line
  Line
  Line
  Line
查找具有指定属性值的对象
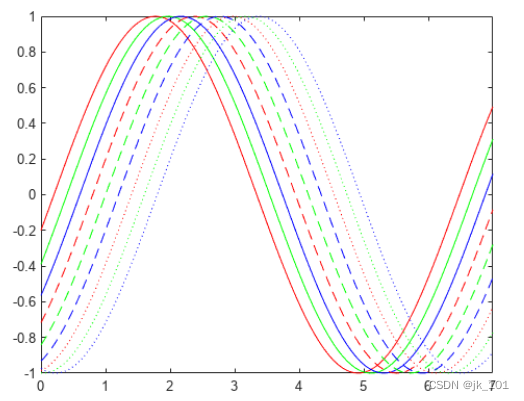
用自定义颜色和线型绘制九个正弦波。
x = linspace(0,7);
y = ones(length(x),9);
for i = 1:9
    y(:,i) = sin(x-i/5)';
end
plot(x,y)

colororder({'red','green','blue'})
ax = gca;
ax.LineStyleOrder = {'-','--',':'};
如图所示:
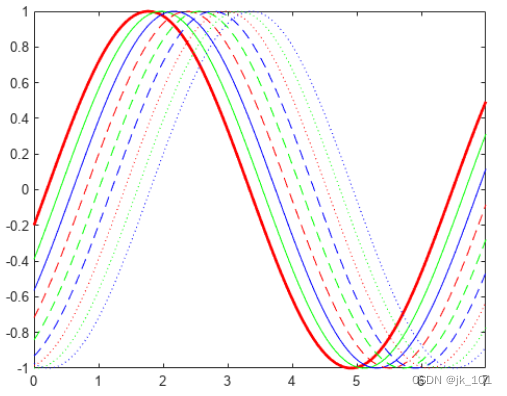
返回红色实线。然后,更改线条的粗细。
h = findobj('Color','red','LineStyle','-')
h =
  Line with properties:

              Color: [1 0 0]
          LineStyle: '-'
          LineWidth: 0.5000
             Marker: 'none'
         MarkerSize: 6
    MarkerFaceColor: 'none'
              XData: [0 0.0707 0.1414 0.2121 0.2828 0.3535 0.4242 0.4949 0.5657 0.6364 0.7071 0.7778 0.8485 0.9192 0.9899 1.0606 1.1313 1.2020 1.2727 1.3434 1.4141 1.4848 1.5556 1.6263 1.6970 1.7677 1.8384 1.9091 1.9798 2.0505 2.1212 2.1919 2.2626 ... ]
              YData: [-0.1987 -0.1289 -0.0586 0.0121 0.0827 0.1529 0.2224 0.2907 0.3576 0.4226 0.4856 0.5462 0.6040 0.6588 0.7103 0.7582 0.8024 0.8426 0.8785 0.9101 0.9371 0.9594 0.9769 0.9896 0.9973 1.0000 0.9977 0.9905 0.9782 0.9611 0.9392 0.9126 ... ]

  Show all properties
h.LineWidth = 2;如图所示:
使用逻辑表达式查找对象
创建一个多线图。为每个图指定一个标识符。
x = linspace(-1,1);
y1 = x;
plot(x,y1,'Tag','linear')
hold on
y2 = x.^2;
plot(x,y2,'Tag','quadratic')
y3 = exp(x);
plot(x,y3,'Tag','exponential')
y4 = sin(x);
plot(x,y4,'Tag','sinusoidal')
hold off
如图所示:
查找其 Tag 属性未设置为 'linear' 的所有对象。
h1 = findobj('-not','Tag','linear')
h1 =
  6x1 graphics array:

  Root
  Figure    (1)
  Axes
  Line      (sinusoidal)
  Line      (exponential)
  Line      (quadratic)
查找其 Tag 属性未设置为 'linear' 或 'quadratic' 的所有对象。
h2 = findobj('-not',{'Tag','linear','-or','Tag','quadratic'})
h2 =
  5x1 graphics array:

  Root
  Figure    (1)
  Axes
  Line      (sinusoidal)
  Line      (exponential)
查找其 Tag 属性未设置为 'linear' 或 'quadratic' 的所有线条对象。
h3 = findobj('Type','line','-not',{'Tag','linear','-or','Tag','quadratic'})
h3 =
  2x1 Line array:

  Line    (sinusoidal)
  Line    (exponential)
通过使用 '-and' 和花括号来提高前面语句的可读性。
h4 = findobj({'Type','line'},'-and',{'-not',{'Tag','linear','-or','Tag','quadratic'}})
h4 =
2x1 Line array:
Line (sinusoidal)
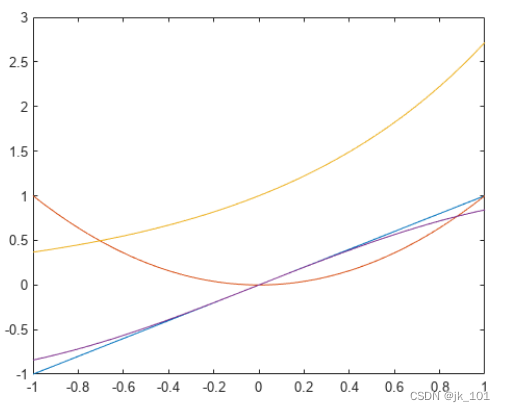
Line (exponential)使用正则表达式查找对象
创建三个线图,并为其中两个图指定标识符。
x = linspace(-1,1);
y1 = x;
plot(x,y1)
hold on
y2 = x.^2;
plot(x,y2,'Tag','Quadratic')
y3 = exp(x);
plot(x,y3,'Tag','Exponential')
hold off
如图所示:
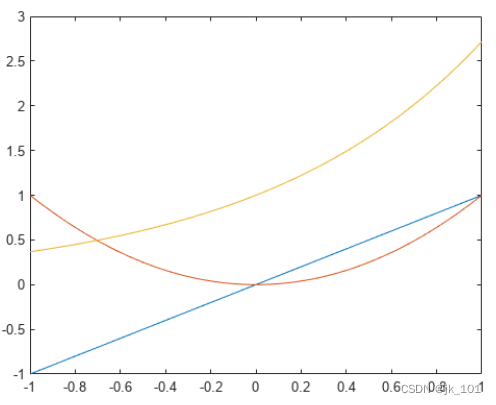
查找具有非空 Tag 属性的所有对象。
h = findobj('-regexp','Tag','[^'']')
h =
  2x1 Line array:

  Line    (Exponential)
  Line    (Quadratic)
查找具有指定属性的所有对象
创建一个包含四个值的向量。使用线图、区域图和条形图显示这些值。
y = [1 5 6 3];
subplot(3,1,1)
plot(y)
subplot(3,1,2)
area(y)
subplot(3,1,3)
bar(y)
如图所示:

返回具有 BaseValue 属性的所有对象。
h = findobj('-property','BaseValue')
h =
  2x1 graphics array:

  Bar
  Area
查找当前坐标区中的所有线条对象
创建一个随机值图,然后返回当前坐标区中的所有线条对象。
plot(rand(5))如图所示:

h = findobj(gca,'Type','line')
h =
  5x1 Line array:

  Line
  Line
  Line
  Line
  Line
使用 h 查询第一个 Line 对象的 y 值。
values = h(1).YData
values = 1×5

    0.6557    0.0357    0.8491    0.9340    0.6787
查找当前图窗中的所有对象
创建包含两个选项卡的图窗。通过为每个选项卡指定父容器,将坐标区添加到每个选项卡上。在第一个选项卡中绘制一条直线,在第二个选项卡中绘制一个曲面。
figure
tab1 = uitab('Title','Tab1');
ax1 = axes(tab1);
plot(ax1,1:10)

tab2 = uitab('Title','Tab2');
ax2 = axes(tab2);
surf(ax2,peaks)
如图所示:
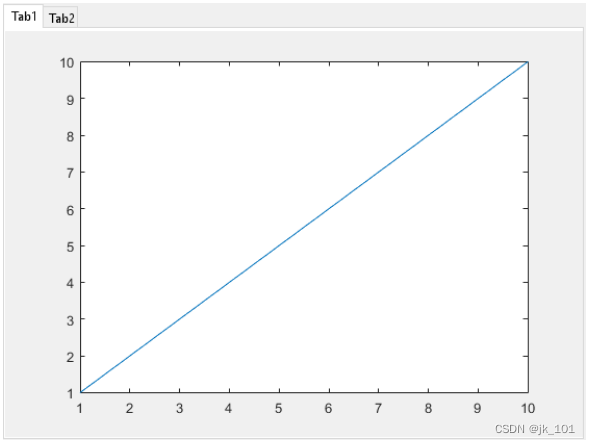
返回当前图窗中的所有对象及其后代。
h = findobj(gcf)
h =
  8x1 graphics array:

  Figure      (1)
  TabGroup
  Tab         (Tab1)
  Tab         (Tab2)
  Axes
  Axes
  Line
  Surface
限制搜索深度
创建带有两个堆叠子图的图窗。
subplot(2,1,1)
x = linspace(0,10);
y1 = sin(x);
plot(x,y1)

subplot(2,1,2)
y2 = sin(5*x);
plot(x,y2)
如图所示:
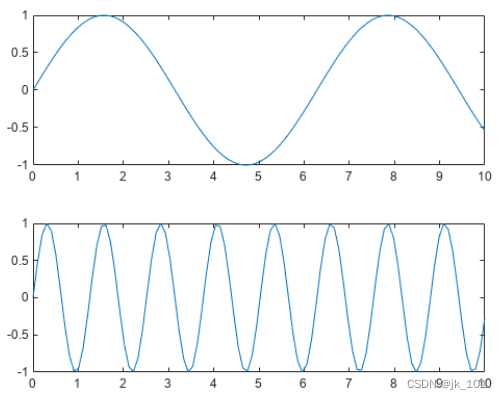
查找当前图窗中的所有对象及其子级。
h1 = findobj(gcf,'-depth',1)
h1 =
  3x1 graphics array:

  Figure    (1)
  Axes
  Axes
查找当前图窗中的所有对象以及在图形对象层次结构中低两级的任何后代。
h2 = findobj(gcf,'-depth',2)
h2 =
  5x1 graphics array:

  Figure    (1)
  Axes
  Axes
  Line
  Line
使用 'flat' 选项将搜索范围限制为当前图窗和当前坐标区。
h3 = findobj([gcf,gca],'flat')
h3 =
  2x1 graphics array:

  Figure    (1)
  Axes
提示
如果对象的 HandleVisibility 属性设置为 'off',则 findobj 不会返回该图形对象或其任何后代。要返回层次结构中的所有对象,包括隐藏的对象,请使用 findall 函数。
findobj 与任何合法的属性值正确匹配。例如,以下代码查找 Color 属性设置为 red、r 或 [1 0 0] 的所有对象:
findobj('Color','r')如果某个图形对象是 objhandles 中标识的多个对象的后代,则每次 findobj 遇到其句柄时,MATLAB 都会搜索该对象。因此,隐式引用某个图形对象可能会导致多次返回该对象。