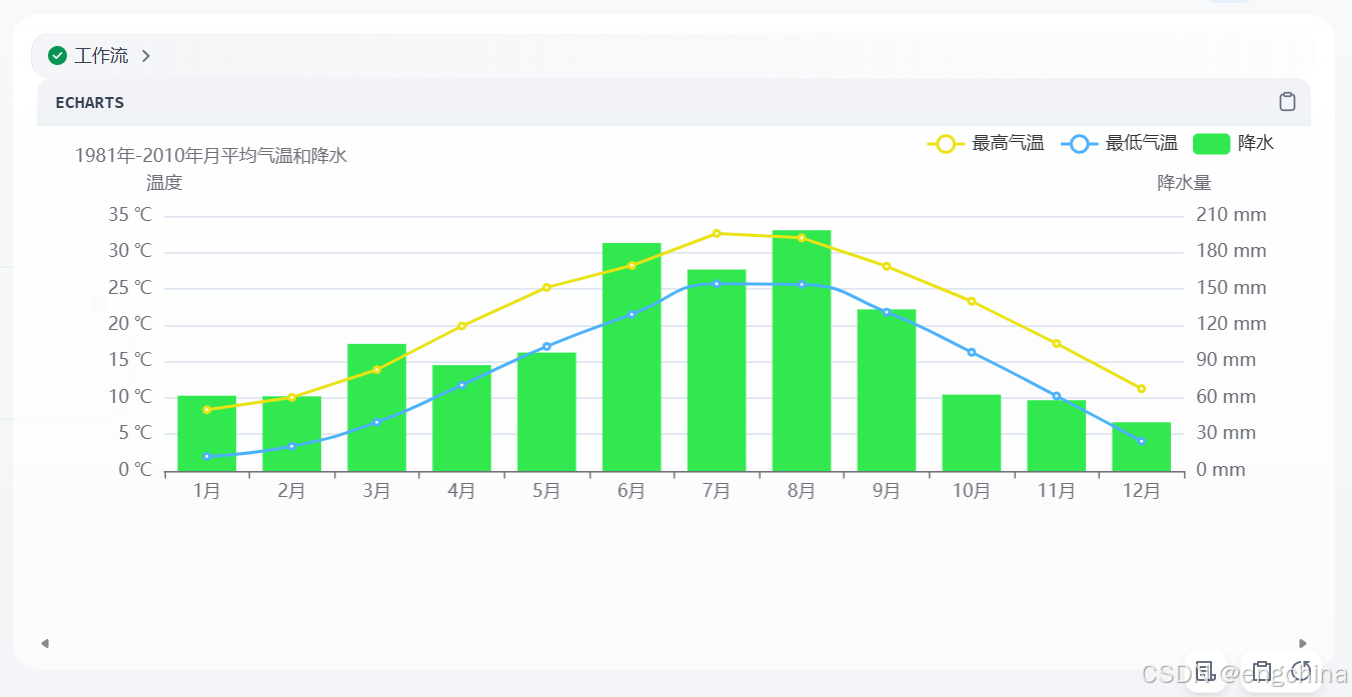
Dify 获取天气数据并以echarts图表显示
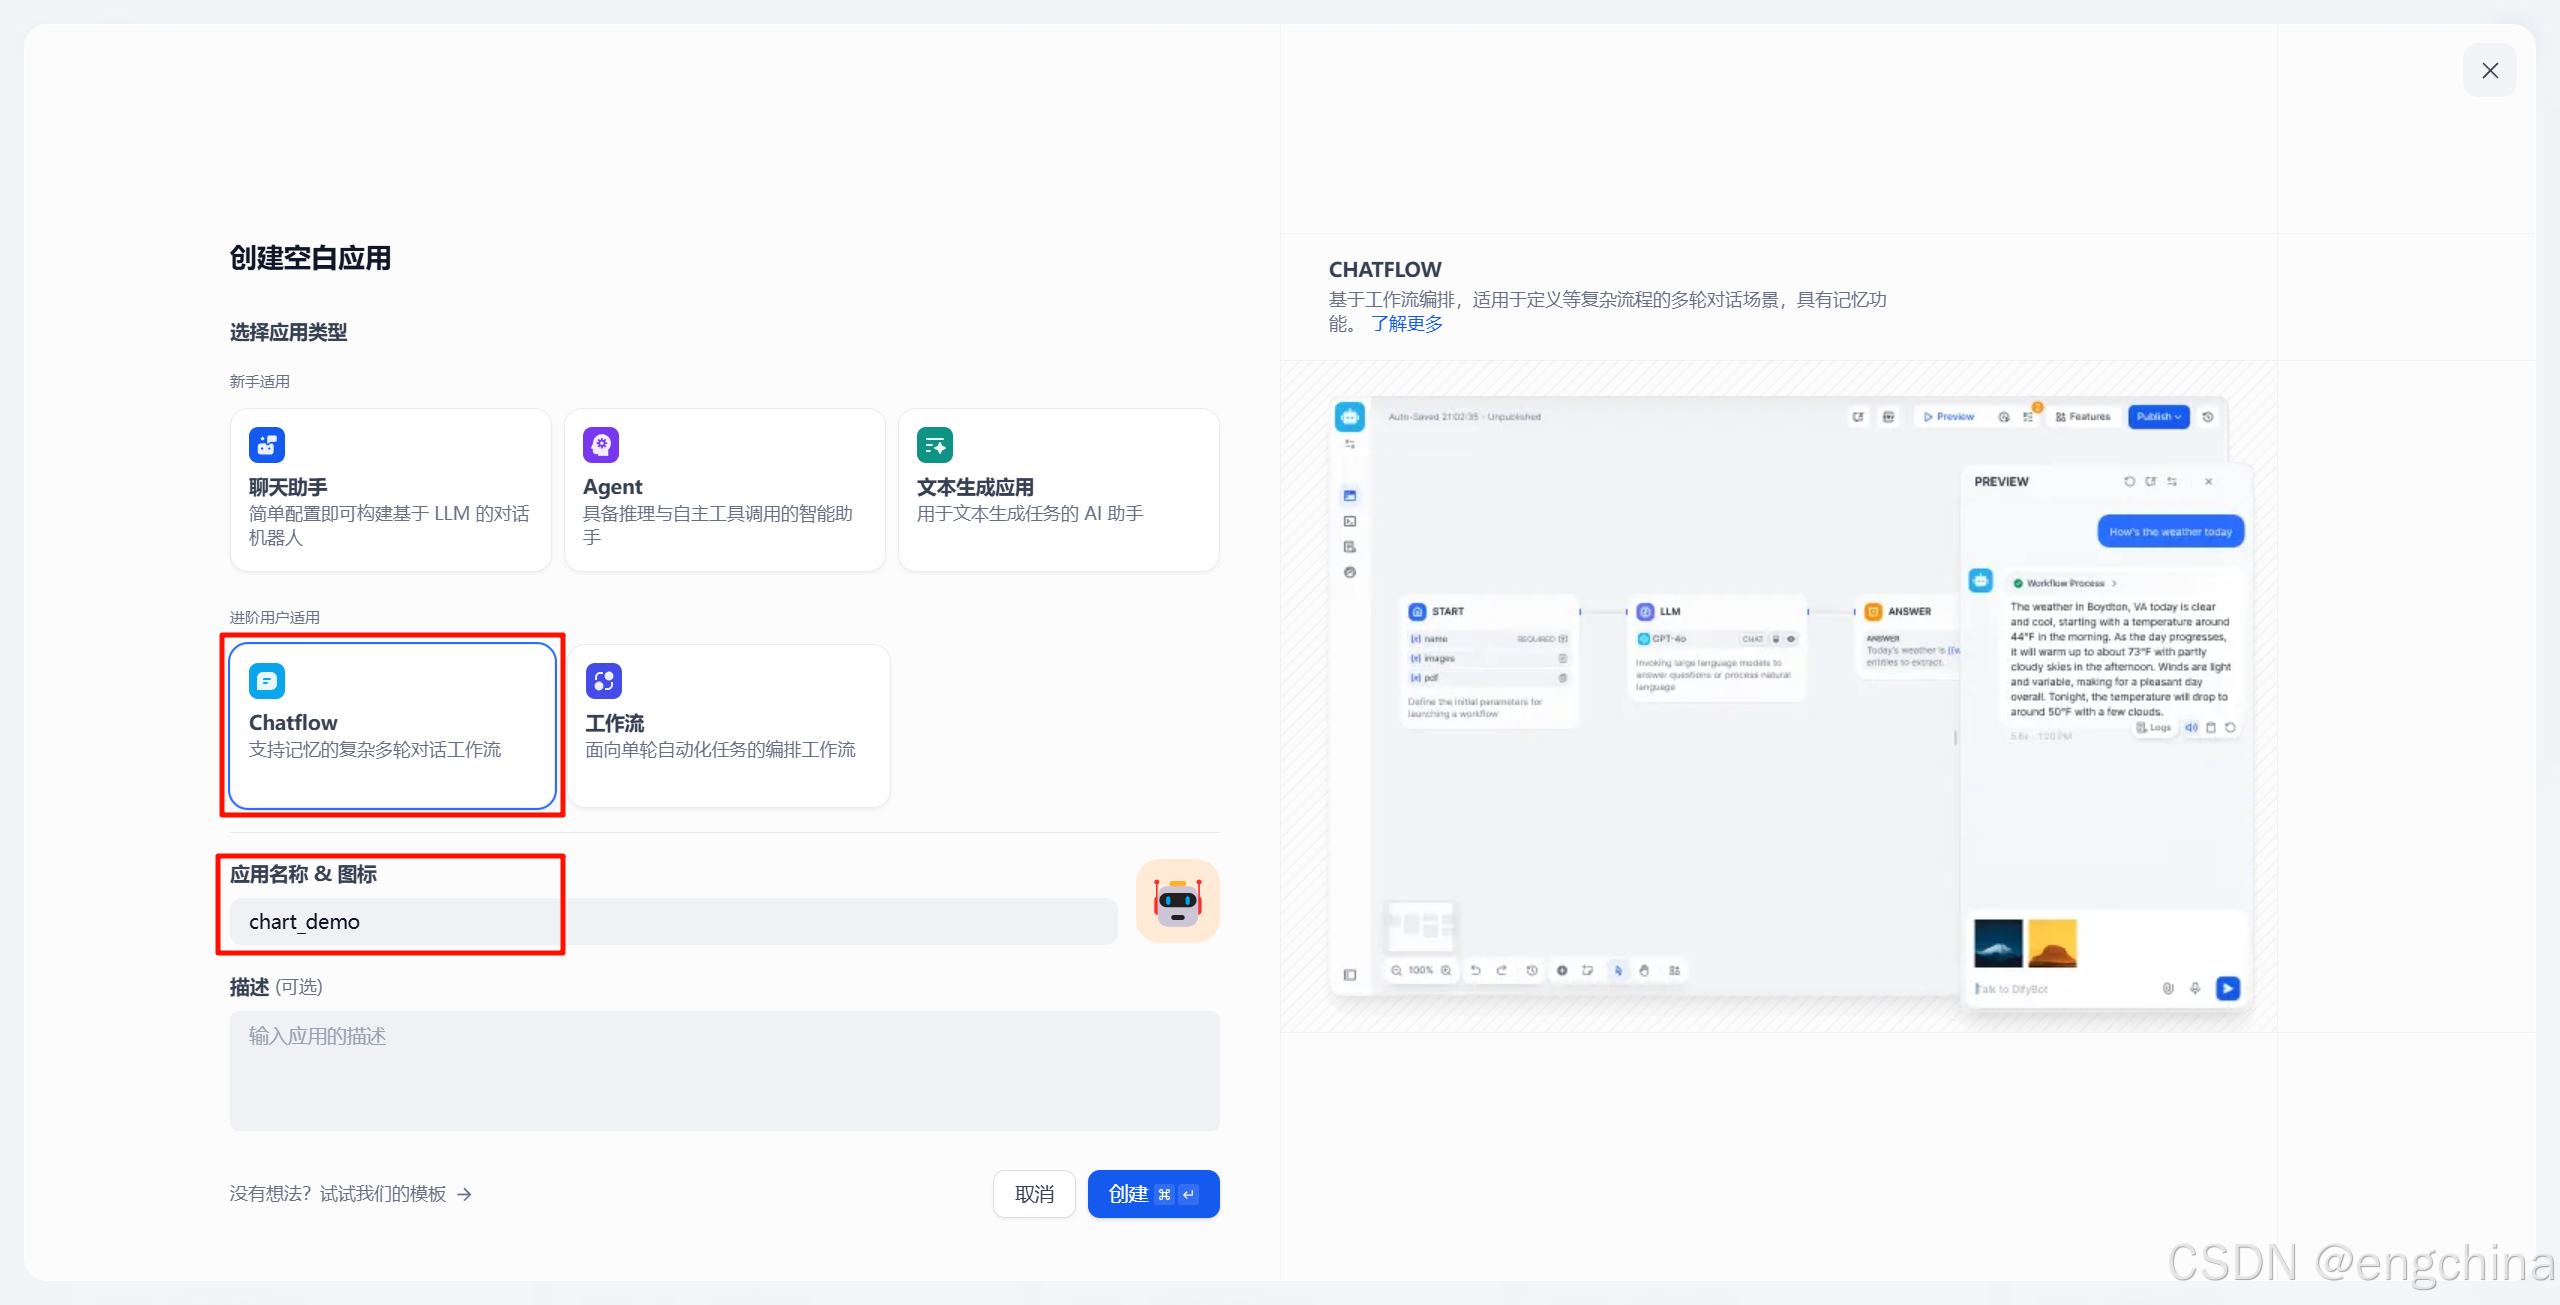
1. 创建一个 Chatflow
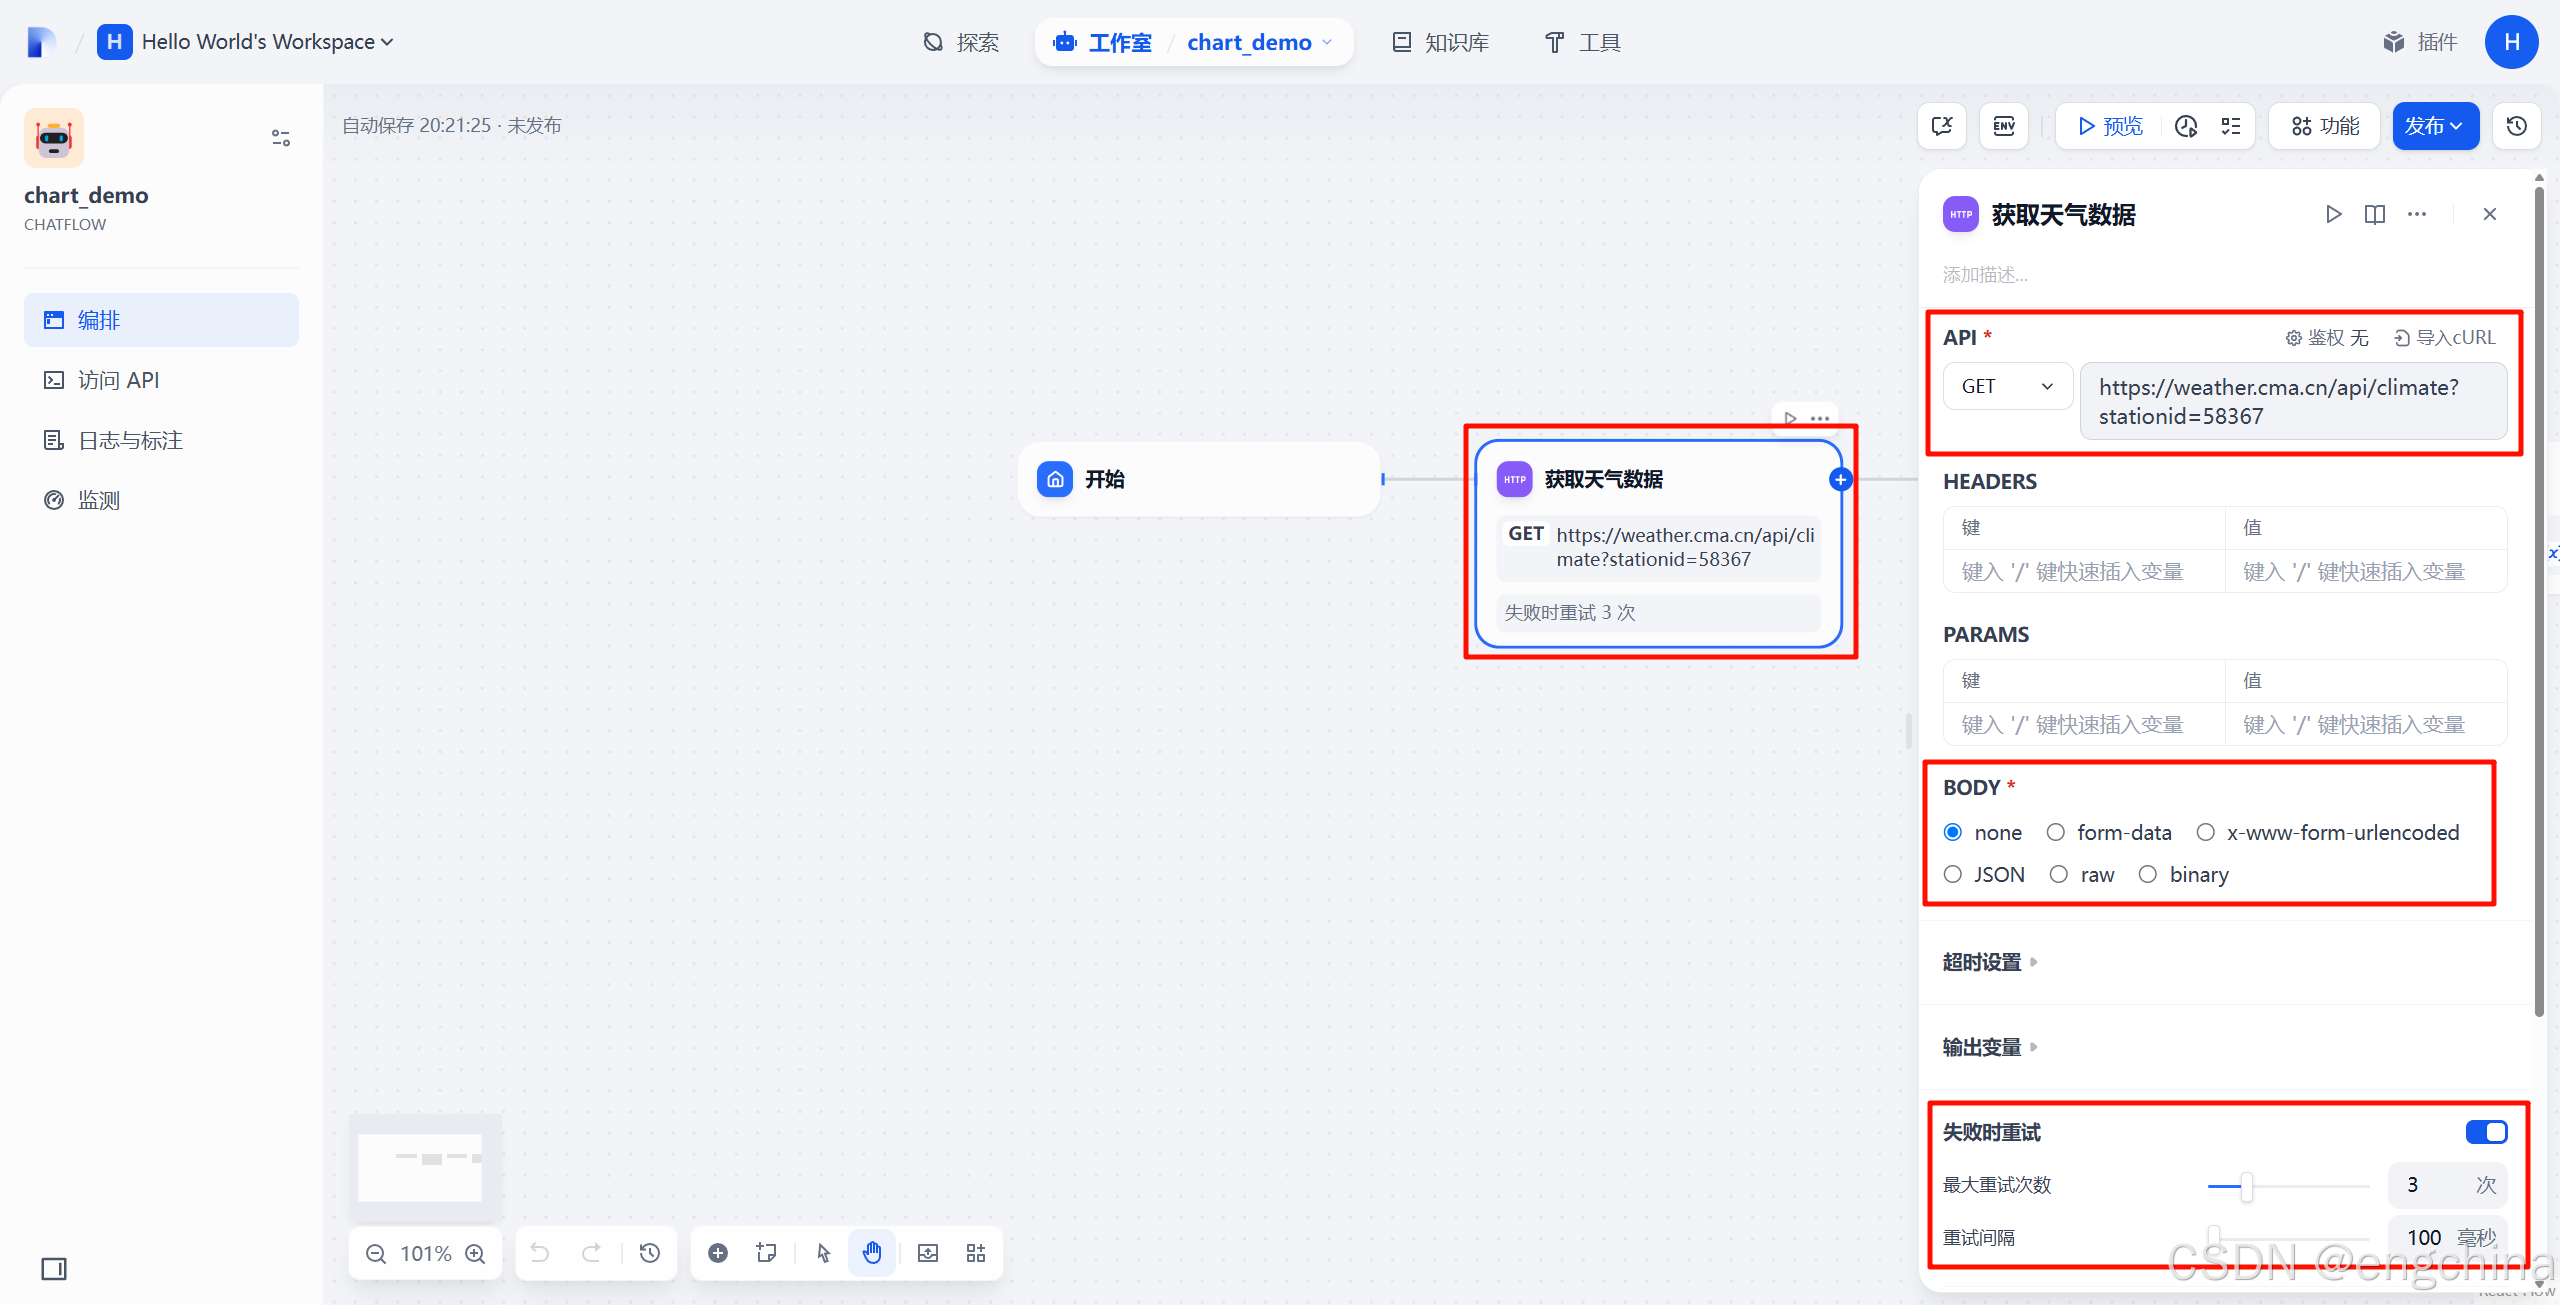
2. 创建一个 HTTP 请求节点
请求地址:https://weather.cma.cn/api/climate?stationid=58367
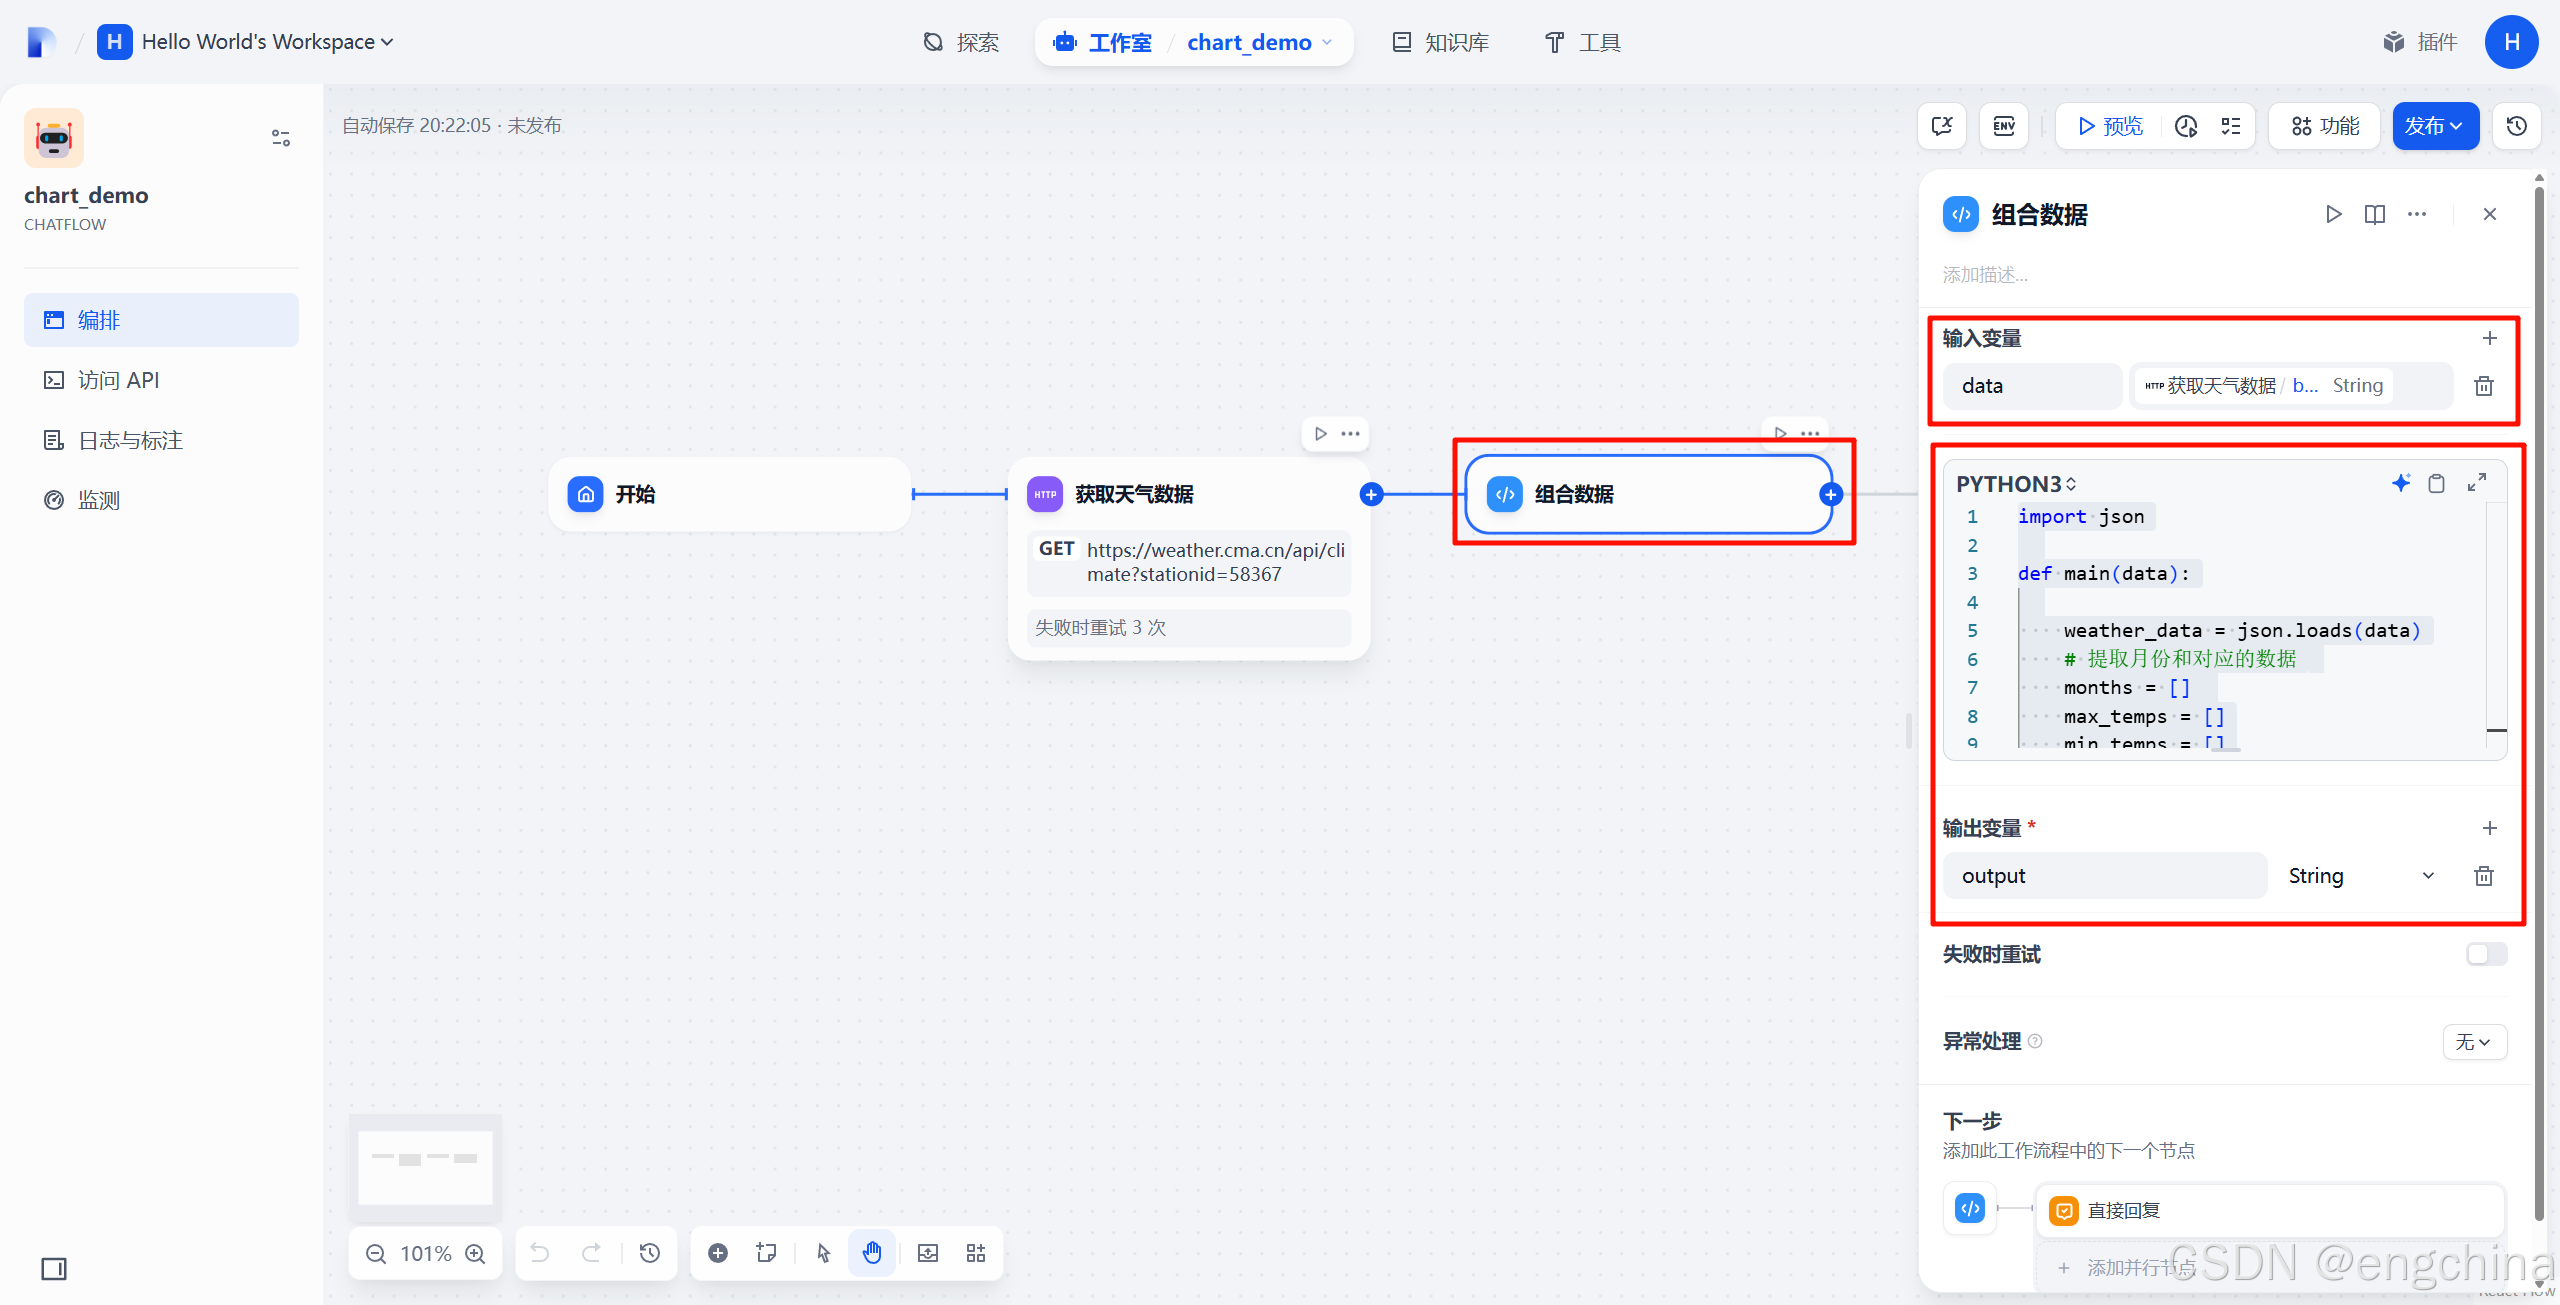
3. 创建一个代码执行节点
代码如下,
import json

def main(data):

    weather_data = json.loads(data)
    # 提取月份和对应的数据
    months = []
    max_temps = []
    min_temps = []
    rainfall = []

    for item in weather_data['data']['data']:
        months.append(f"{item['month']}月")
        max_temps.append(item['maxTemp'])
        min_temps.append(item['minTemp'])
        rainfall.append(item['rainfall'])

    # 生成echarts配置
    echarts_config = {
        "color": ['#eb6877', '#0f91c4', '#46cbd4'],
        "title": {
            "subtext": f"{weather_data['data']['beginYear']}年-{weather_data['data']['endYear']}年月平均气温和降水",
            "left": 20
        },
        "tooltip": {
            "trigger": "axis",
            "axisPointer": {
                "type": "cross"
            }
        },
        "legend": {
            "data": ["最高气温", "最低气温", "降水"],
            "right": 20
        },
        "xAxis": {
            "data": months,
            "axisLine": {
                "onZero": False
            }
        },
        "yAxis": [
            {
                "type": "value",
                "name": "温度",
                "position": "left",
                "axisLabel": {
                    "formatter": "{value} ℃"
                }
            },
            {
                "type": "value",
                "name": "降水量",
                "min": 0,
                "position": "right",
                "axisLabel": {
                    "formatter": "{value} mm"
                }
            }
        ],
        "series": [
            {
                "name": "最高气温",
                "type": "line",
                "data": max_temps,
                "yAxisIndex": 0,
                "itemStyle": {
                    "color": "#eae213"
                }
            },
            {
                "name": "最低气温",
                "type": "line",
                "smooth": True,
                "data": min_temps,
                "yAxisIndex": 0,
                "itemStyle": {
                    "color": "#4bb2fa"
                }
            },
            {
                "name": "降水",
                "type": "bar",
                "smooth": True,
                "data": rainfall,
                "yAxisIndex": 1,
                "itemStyle": {
                    "color": "#31e84f"
                }
            }
        ]
    }

    # 生成输出文件
    output = "```echarts\n" + json.dumps(echarts_config, indent=2, ensure_ascii=False) + "\n```"

    return {"output":output}
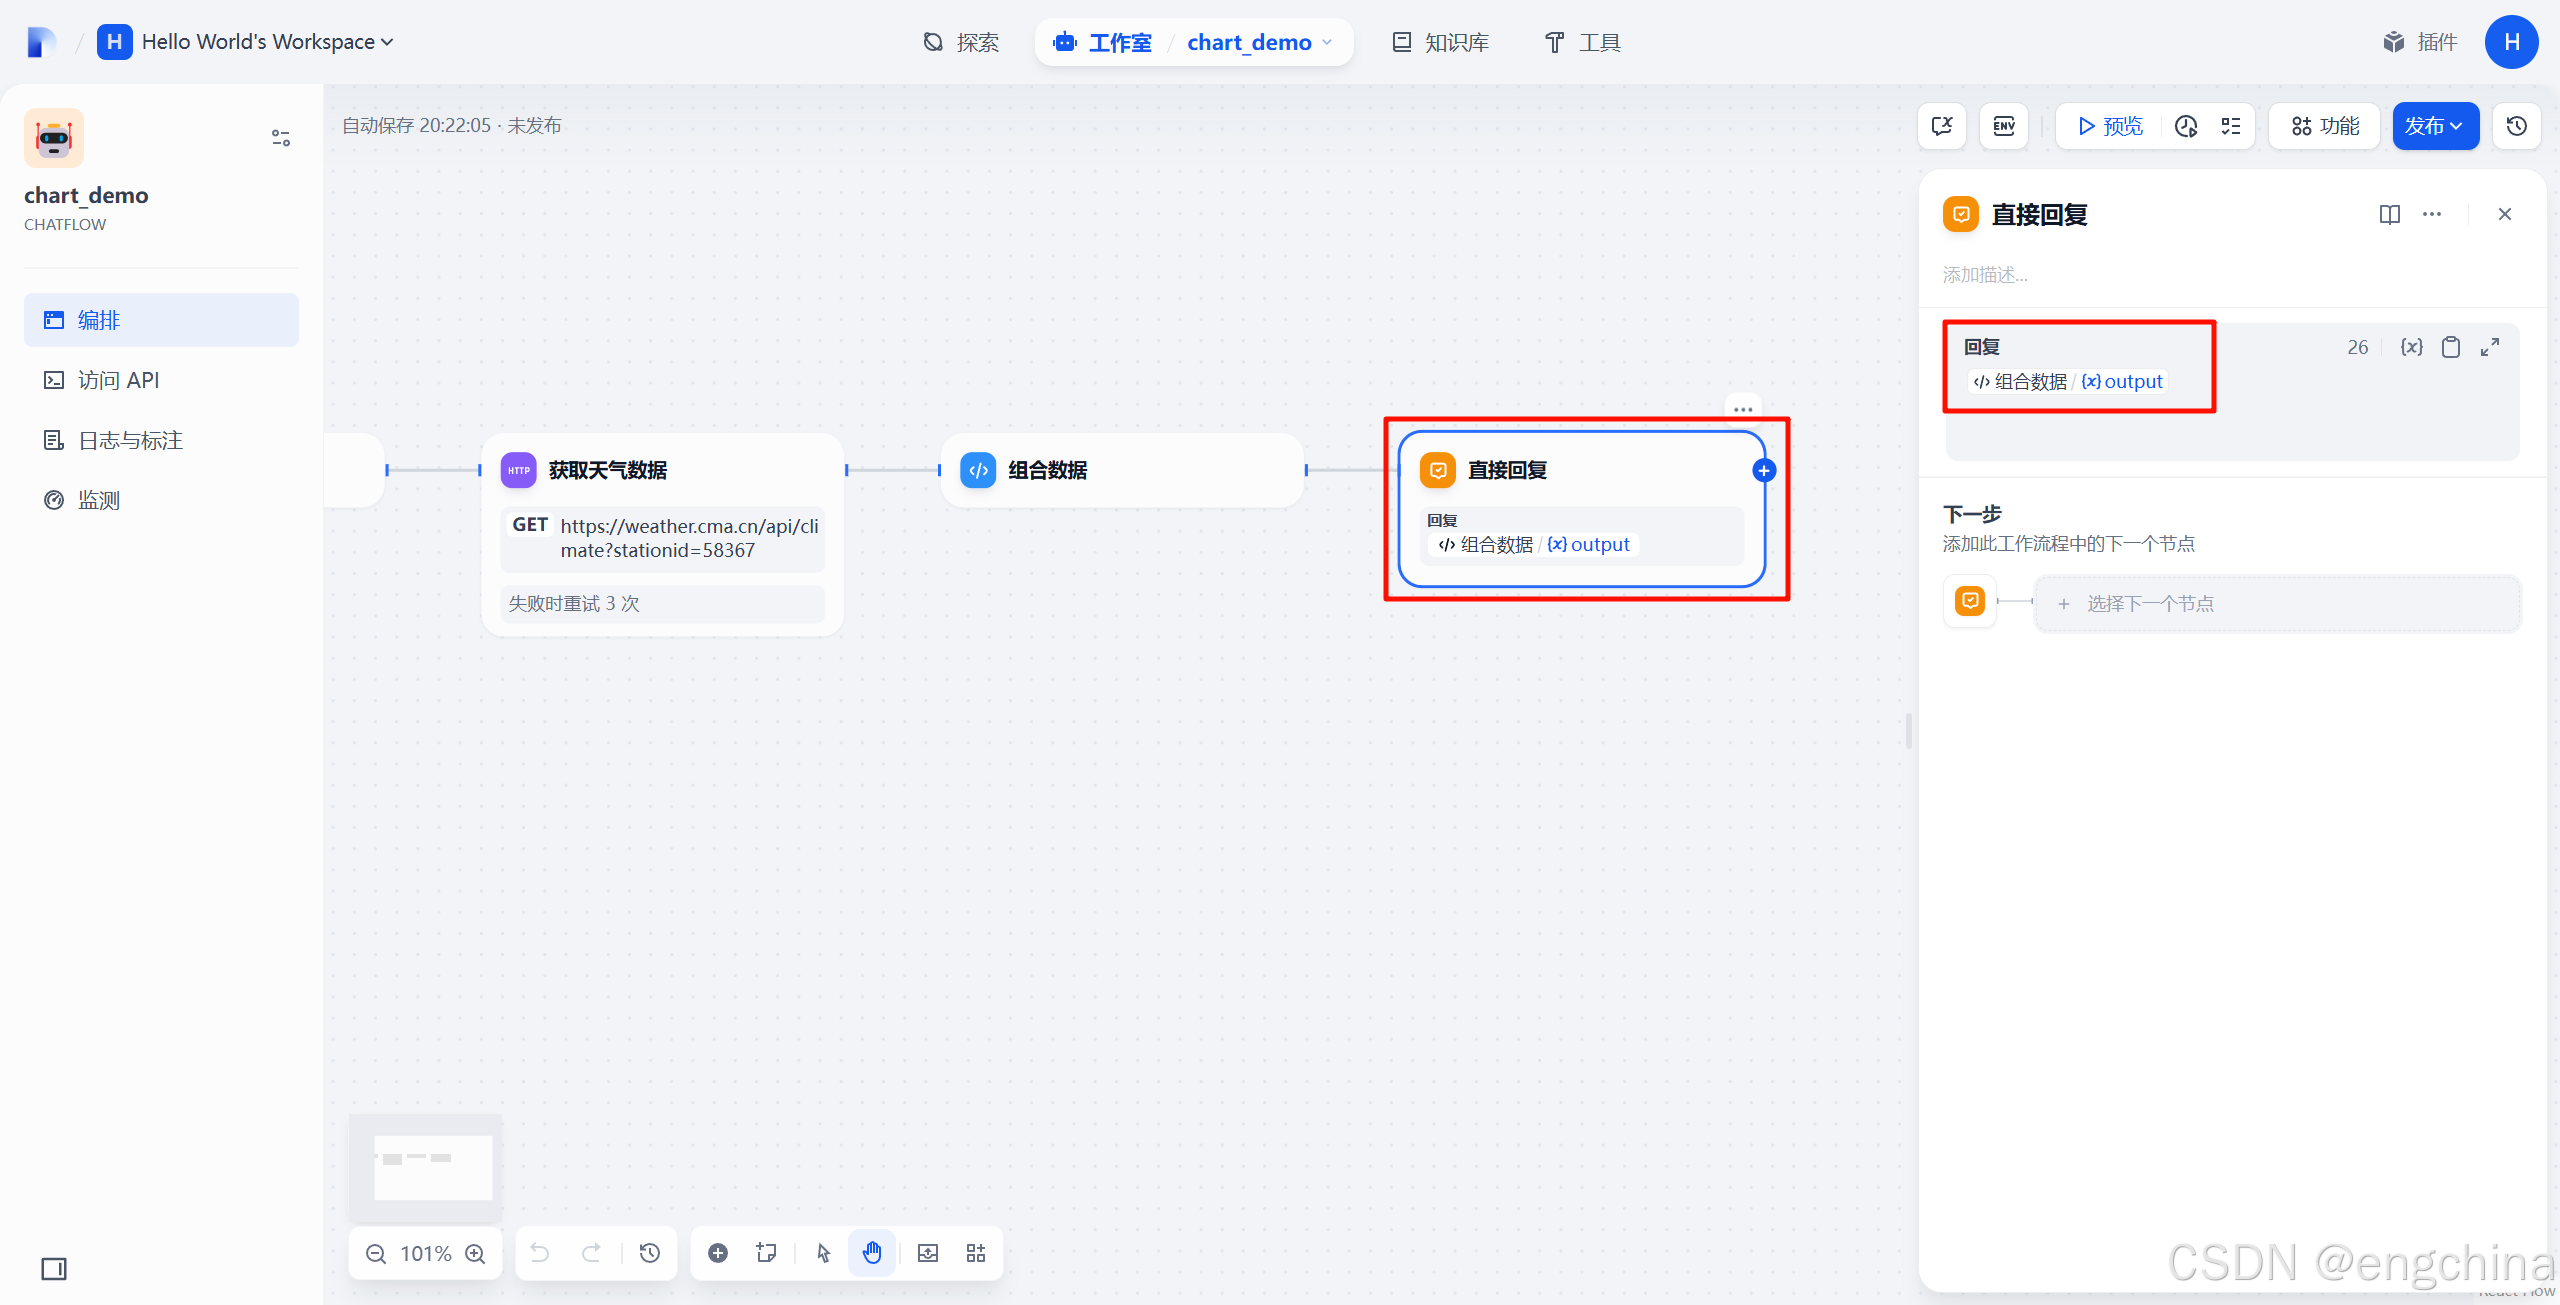
4. 创建一个直接回复节点
5. 发布并预览
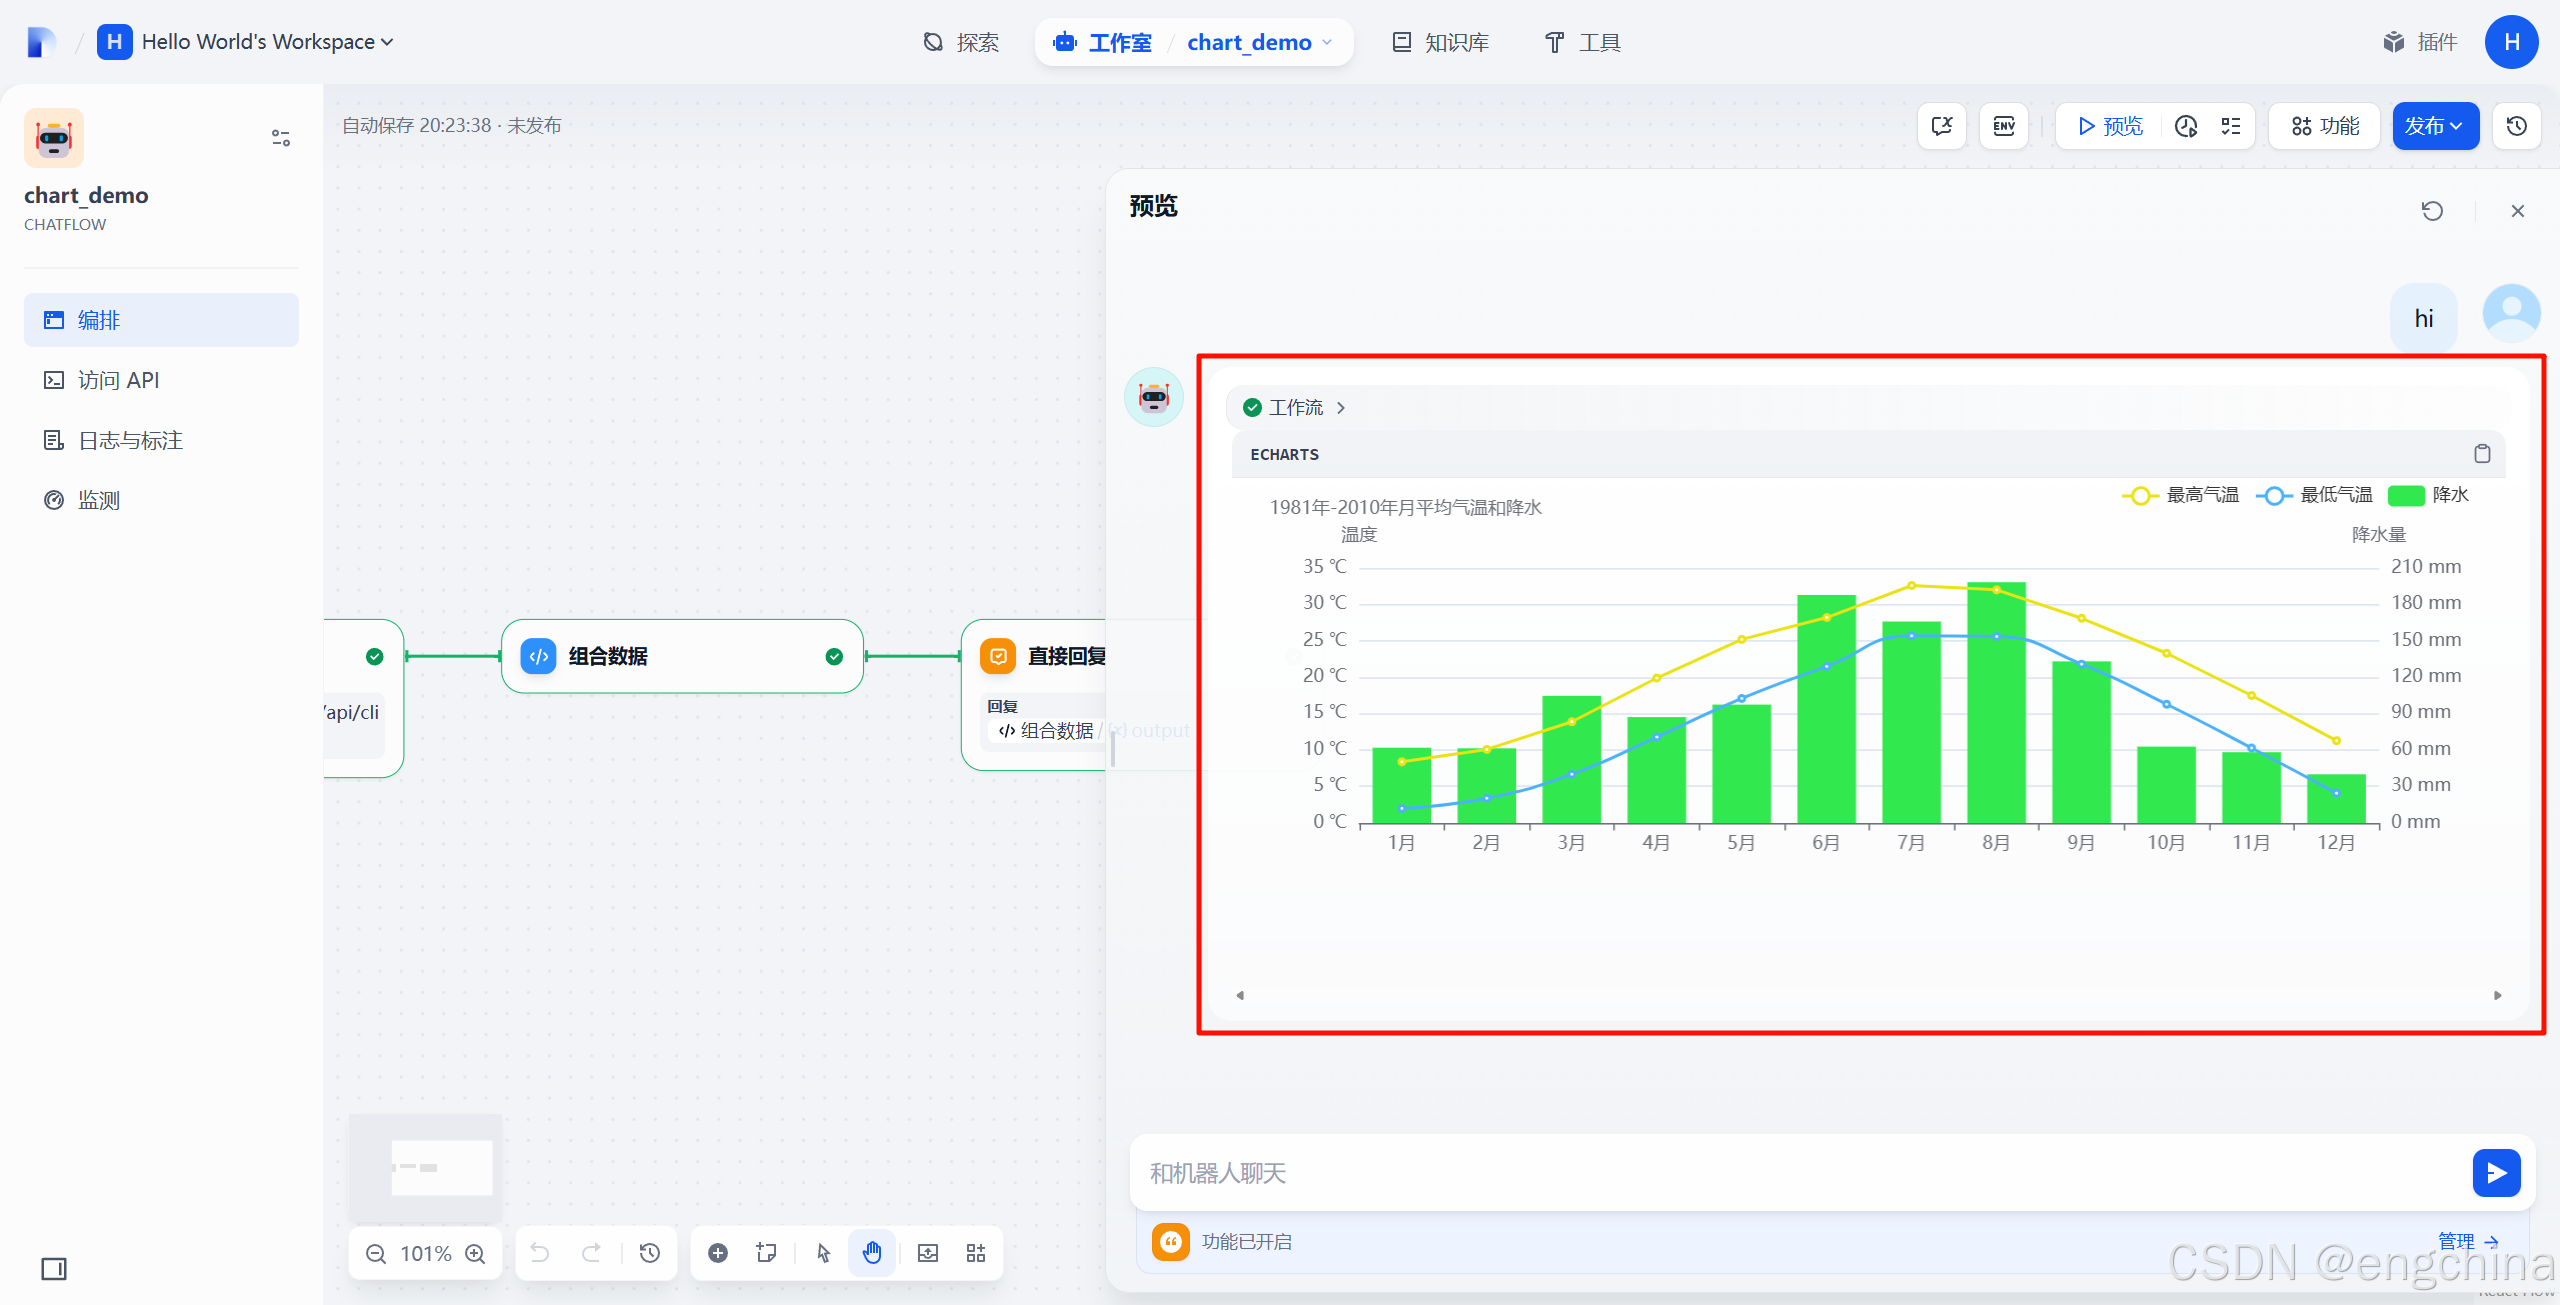
完结!