前言:
今天写day11的内容,主要讲了四个统计接口的制作。看起来内容较多,其实代码逻辑都是相似的,这里我们过一遍。
今日所学:
- Apache ECharts
- 营业额统计
- 用户统计
- 订单统计
- 销量排行统计
1. Apache ECharts
1.1 介绍
Apache ECharts 是一个功能强大、易于使用的数据可视化工具,适用于多种场景下的数据展示需求。通过简单的配置和灵活的定制,用户可以快速生成美观且交互性强的图表,提升数据分析和展示的效果。
总结:
Apache ECharts 是一个前端数据可视化库,适用于Web端的数据展示和分析
我们后端需要做的,就是提供符合格式要求的动态数据,然后响应给前端来展示图表。
1.2 使用流程:
1.下载echarts.js
这边黑马的资料中给我们准备好了
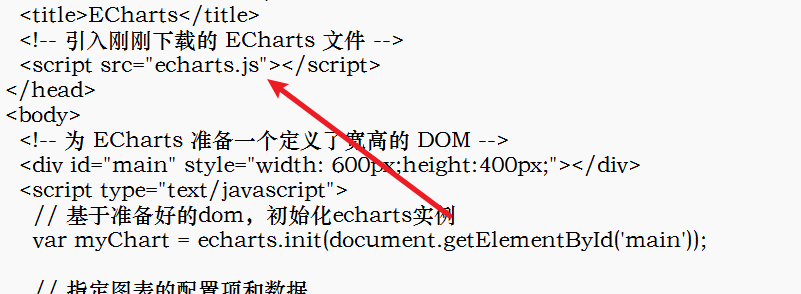
2.在前端的代码中引用
打开echartsDemo.html文件代码,可以看到已成功引入了echarts.js
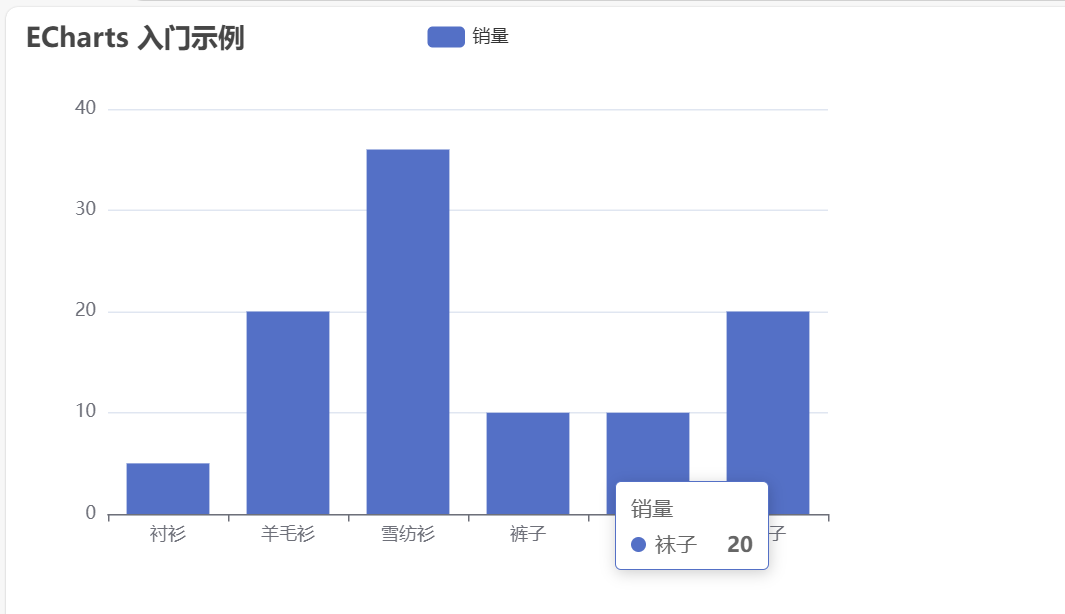
运行这个html文件
2.营业额统计
需求分析
业务规则:
1.营业额指的是订单状态为完成的订单金额合计
2.X轴表示日期,Y轴表示营业额
3. 根据时间选择区间,展示每天的营业额数据
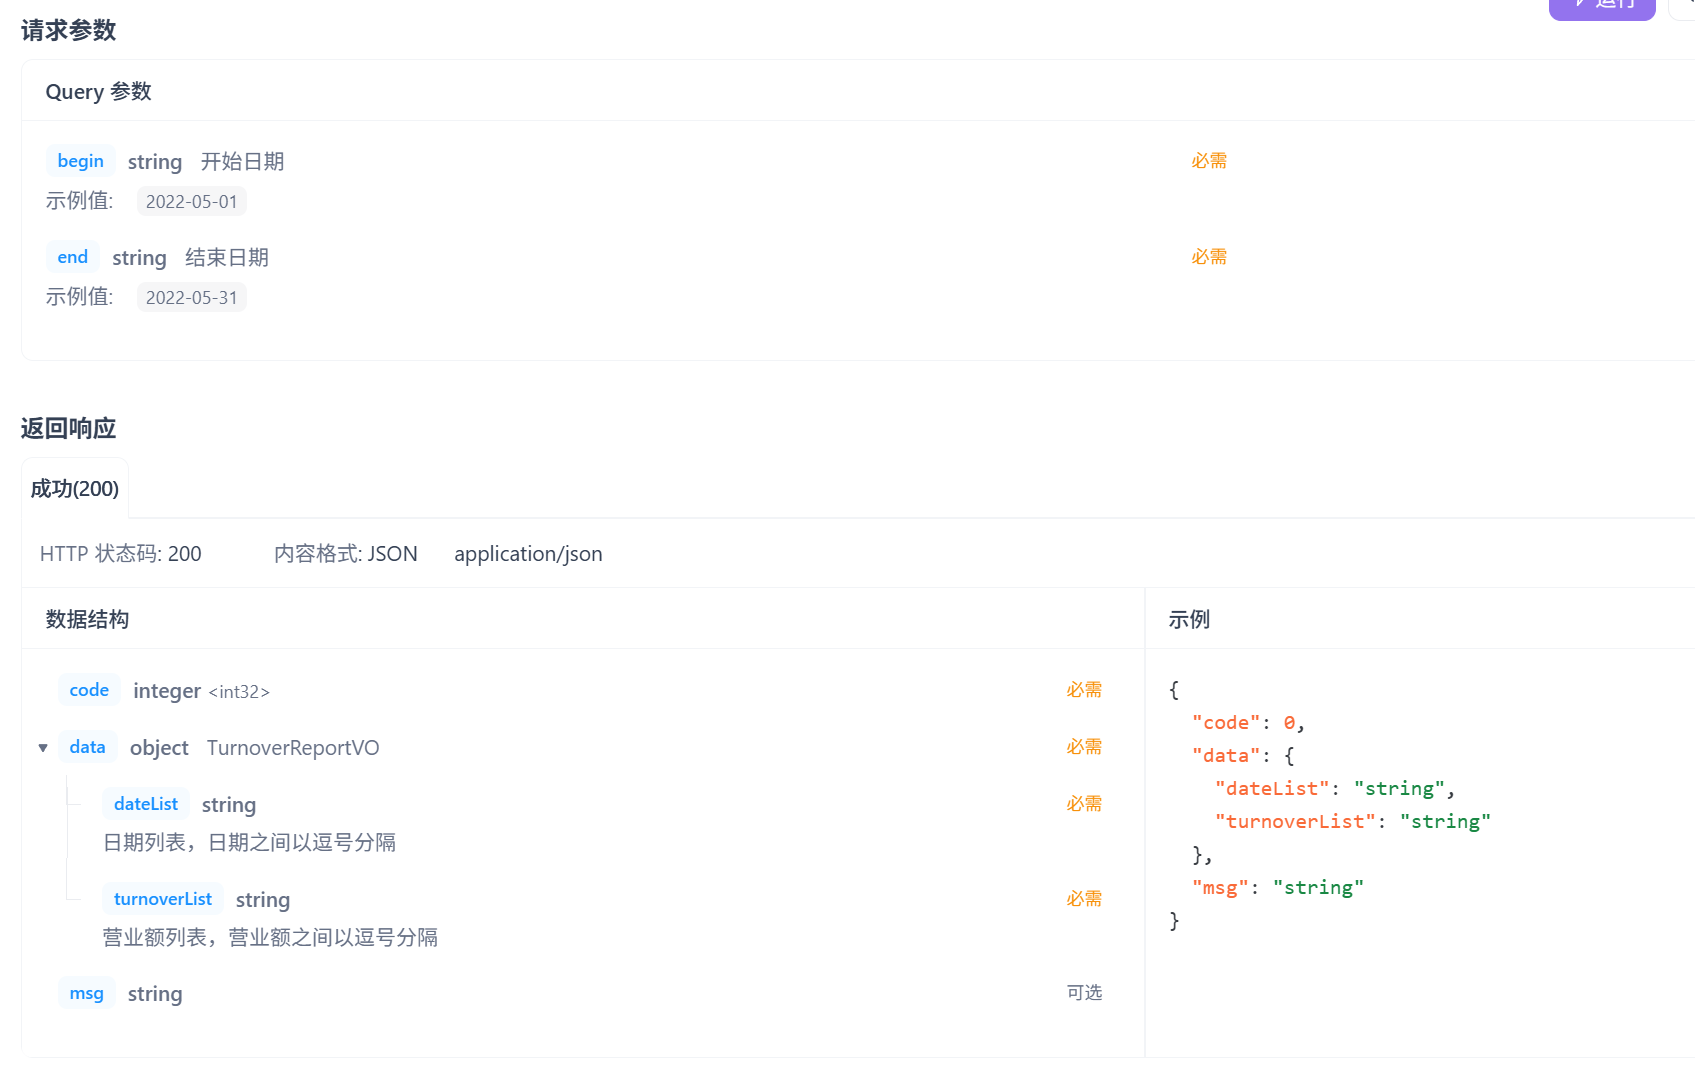
请求参数是开始时间和结束时间,这里注意传给前端的dataList和turnoverList都要是String类型的数据
代码展示
Controller层:
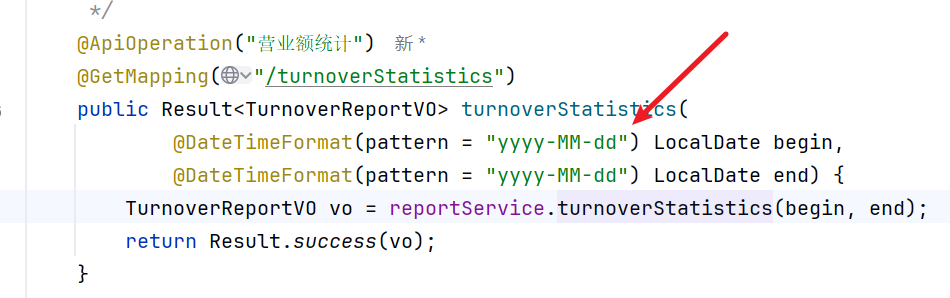
这里注意begin,end是LocalData变量,传入的时候要指定时间格式
service层:
这里具体的代码逻辑是:
1.先是定义两个arrayList容器用于后续储存每日的日期还有相应的营业额
2.while循环储存从开始(begin)到结束(end)的每一天日期数据
3.将每一天的日期数据(LocalData变量)转换成(LocalDataTime变量),分别取极小值(00:00:00)和极大值(23:59:5999)
4.调用Ordermapper,执行如下SQL语句:
select sum(amount) from Orders where order_time > beginTime(一天的极小值) and order_time < endTime(一天的极大值) and status = 5(已完成)
注意下这里传给mapper的数据是由map储存的
/**
* 指定时间内的营业额
* @param begin
* @param end
* @return
*/
@Override
public TurnoverReportVO turnoverStatistics(LocalDate begin, LocalDate end) {
// 用于储存begin,end范围内每天的日期
List<LocalDate> dateList = new ArrayList<>();
List<Double> turnoverList = new ArrayList<>();
dateList.add(begin);
while(!begin.equals(end)) {
// 指定日期的后一天
begin = begin.plusDays(1);
dateList.add(begin);
}
for (LocalDate date : dateList) {
LocalDateTime beginTime = LocalDateTime.of(date, LocalTime.MIN);
LocalDateTime endTime = LocalDateTime.of(date, LocalTime.MAX);
Map map = new HashMap();
map.put("beginTime", beginTime);
map.put("endTime", endTime);
map.put("status", Orders.COMPLETED);
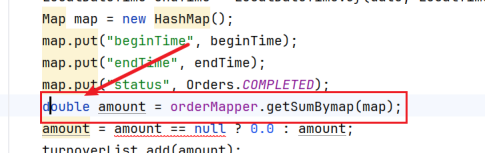
Double amount = orderMapper.getSumBymap(map);
amount = amount == null ? 0.0 : amount;
turnoverList.add(amount);
}
return TurnoverReportVO
.builder()
.turnoverList(StringUtils.join(turnoverList, ","))
.dateList(StringUtils.join(dateList, ","))
.build();
}
mapper层:
<select id="getSumBymap" resultType="java.lang.Double">
select sum(amount) from orders
<where>
<if test="begin != null">
and order_time > #{beginTime}
</if>
<if test="end != null">
and order_time < #{endTime}
</if>
<if test="status != null">
and status = #{status}
</if>
</where>
</select>
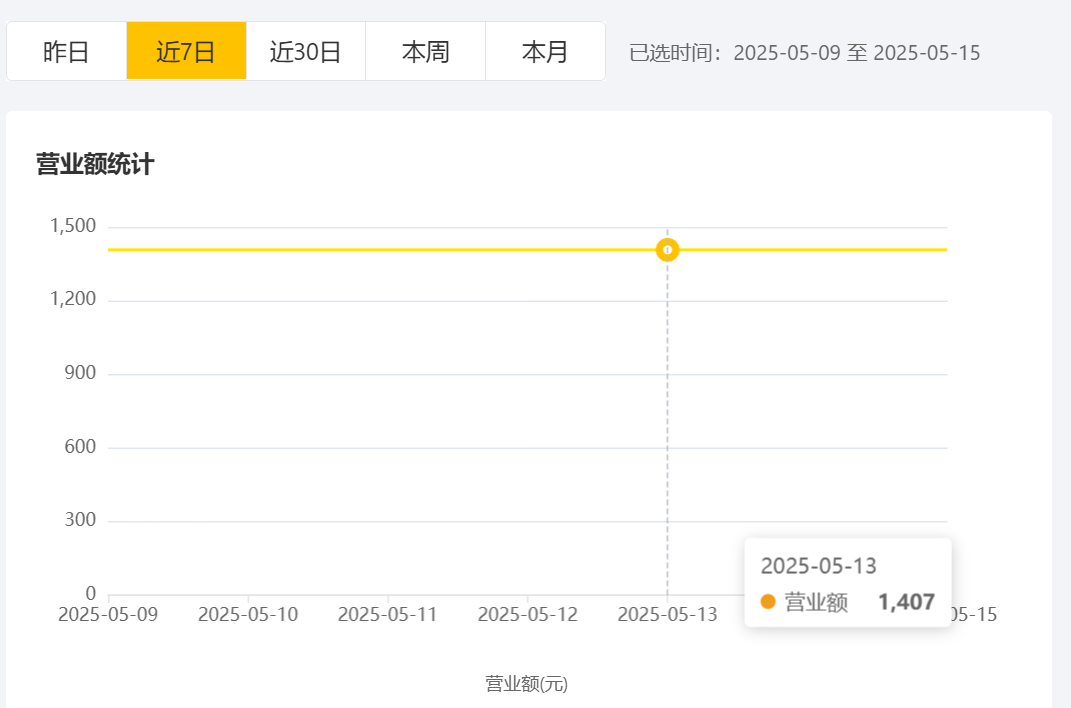
运行展示:
问题
这里我遇到的问题是几个:
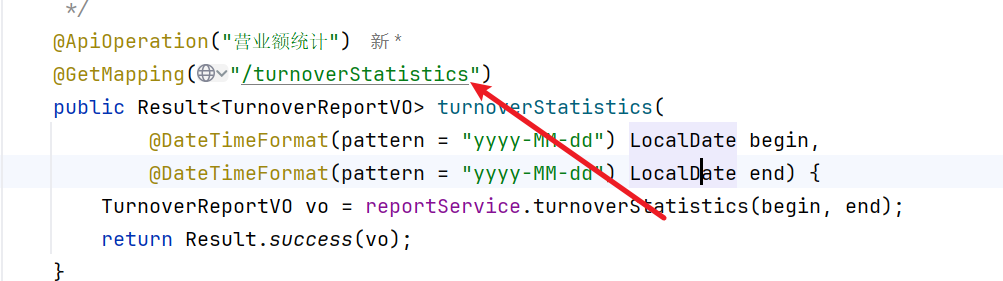
1.路径写错了(写成另一个接口的了),导致前端图表一直展示不出来,改了挺久的
2.StringUtils包导错了
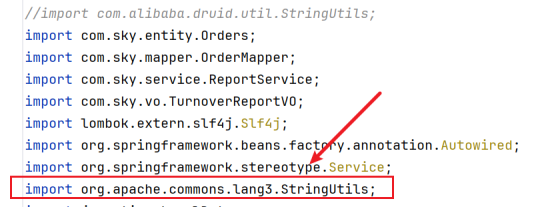
这里要注意导入的是我标注的那个包,而不是我最上面注释掉的那个
3.这里要注意要写的是Double,而不是double.Double是包装类,是一种类,存在null值,而double是一种基本数据类型,是不存在null值的
3.用户统计
需求分析
业务规则:
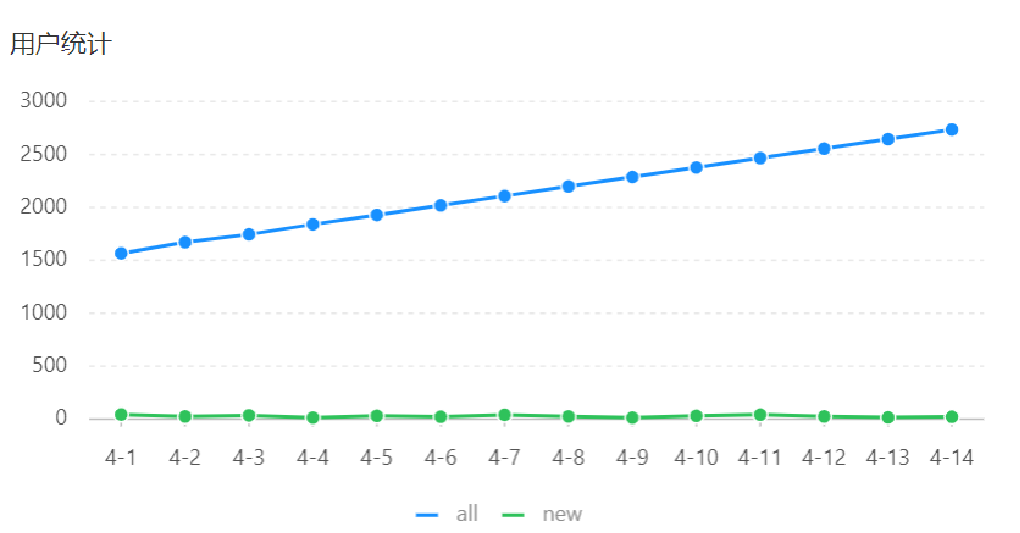
- 基于可视化报表的折线图展示用户数据,X轴为日期,Y轴为用户数
- 根据时间选择区间,展示每天的用户总量和新增用户量数据
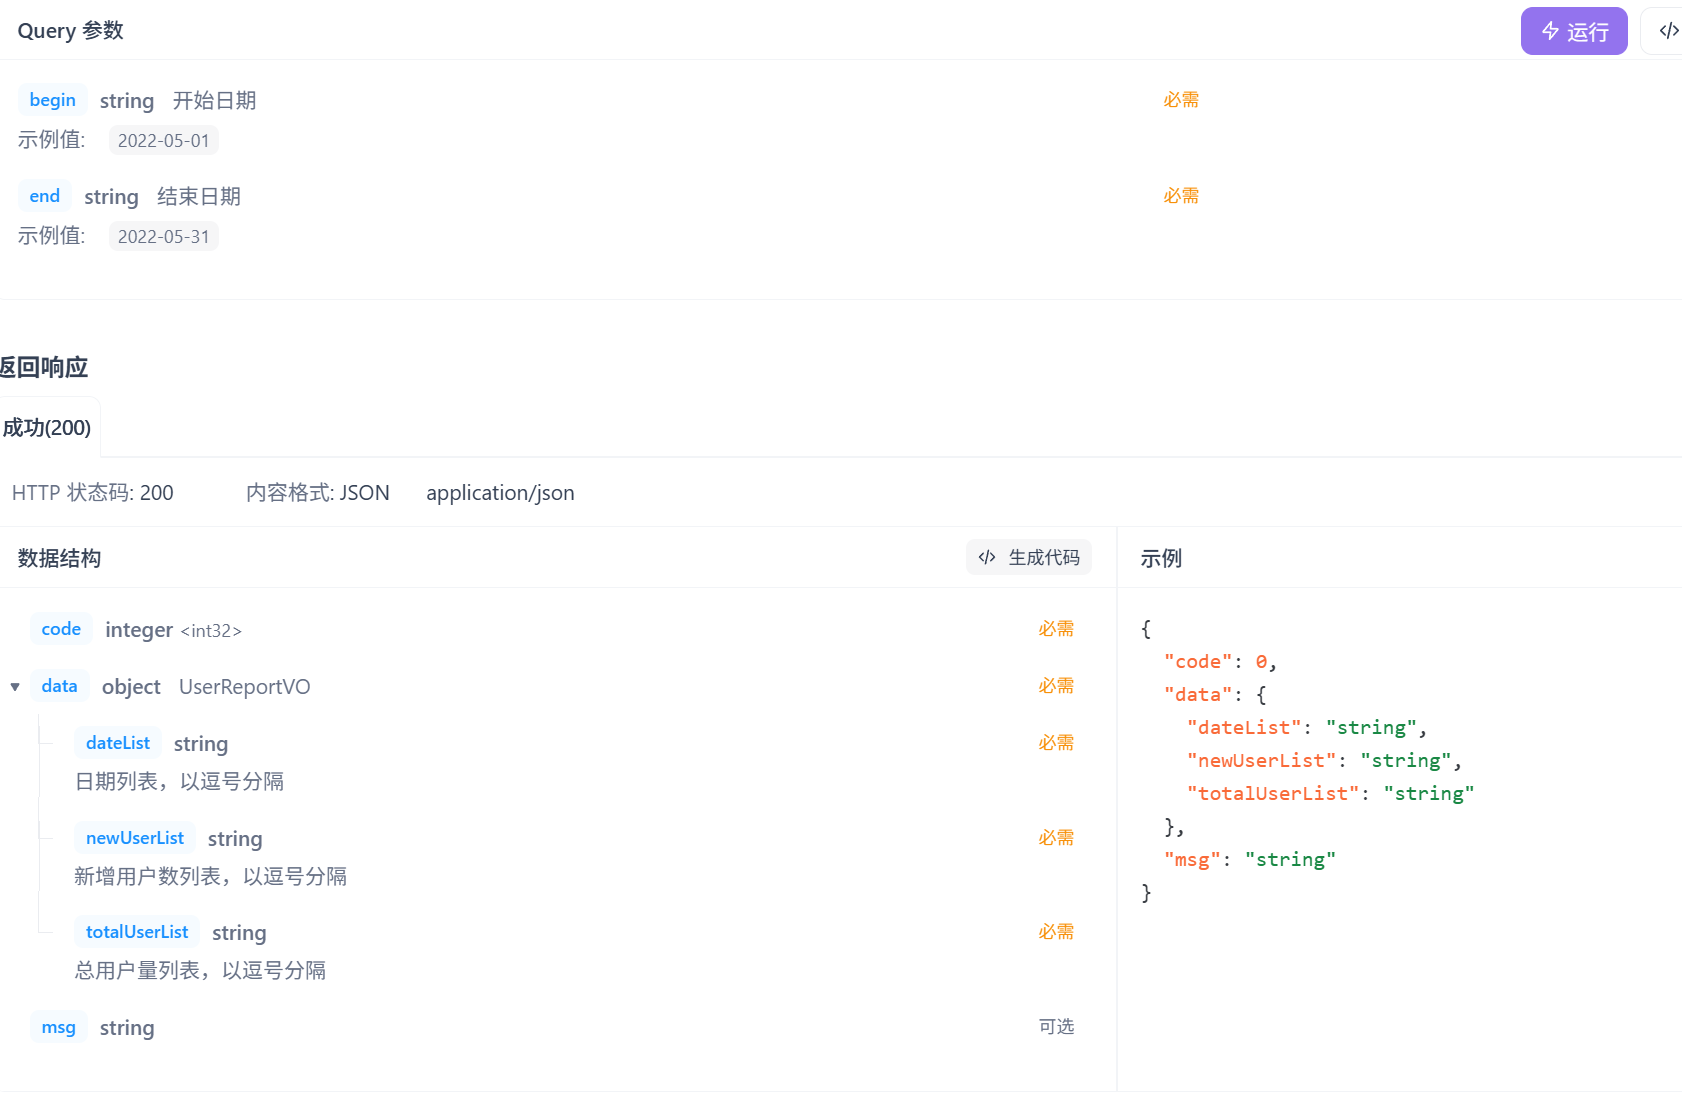
这里的传入参数和返回数据跟营业额统计格式上基本是一致的:传入开始日期和结束日期,
返回数据也都是要String类型的
代码展示:
Controller层:
@ApiOperation("用户统计")
@GetMapping("/userStatistics")
public Result<UserReportVO> userStatistics(
        @DateTimeFormat(pattern = "yyyy-MM-dd") LocalDate begin,
        @DateTimeFormat(pattern = "yyyy-MM-dd") LocalDate end){

    UserReportVO userReportVO = reportService.userStatistics(begin, end);
    return Result.success(userReportVO);
}
这里同样注意传入的LocalData类型的数据要用@DataTimeFormat规定时间格式
Service层:
具体逻辑:
1.定义三个ArrayList格式的数据,分别用于储存每一天的时间,每一天的用户总量,每一天的用户增量
2.while循环得到开始日期到结束日期之间每天的日期
3..将每一天的日期数据(LocalData变量)转换成(LocalDataTime变量),分别取极小值(00:00:00)和极大值(23:59:5999)
4.调用mapper,执行相应的语句,得到每一天的用户总量和用户新增量
这里注意用户总量只要查询endTime就行了,用户新增量再查询beginTime和endTime之间创建的用户,具体SQL执行逻辑:
select count(id) from user where create_time < endTime and create_time > beginTime(求用户新增量的时间再传入相应参数)
mapper参数还是由map传入
/**
 * 用户统计
 * @param begin
 * @param end
 * @return
 */
@Override
public UserReportVO userStatistics(LocalDate begin, LocalDate end) {
    List<LocalDate> dateList = new ArrayList<>();

    dateList.add(begin);
    while(!begin.equals(end)) {
        begin = begin.plusDays(1);
        dateList.add(begin);
    }

    List<Integer> totalUserList = new ArrayList<>();

    List<Integer> newUserList = new ArrayList<>();

    for(LocalDate date : dateList) {
        LocalDateTime beginTime = LocalDateTime.of(date, LocalTime.MIN);
        LocalDateTime endTime = LocalDateTime.of(date, LocalTime.MAX);
        Map map = new HashMap();
        map.put("endTime", endTime);
        Integer userNum = userMapper.countByMap(map);
        map.put("beginTime", beginTime);
        Integer newUserNum = userMapper.countByMap(map);
        userNum = userNum == null ? 0 : userNum;
        totalUserList.add(userNum);
        newUserList.add(newUserNum);
    }


    return UserReportVO.builder()
            .dateList(StringUtils.join(dateList,","))
            .totalUserList(StringUtils.join(totalUserList, ","))
            .newUserList(StringUtils.join(newUserList, ","))
            .build();
}
mapper层
<select id="countByMap" resultType="java.lang.Integer">
select count(id) from user
<where>
<if test="beginTime != null">
and create_time > #{beginTime}
</if>
<if test="beginTime != null">
and create_time < #{endTime}
</if>
</where>
</select>
运行展示:
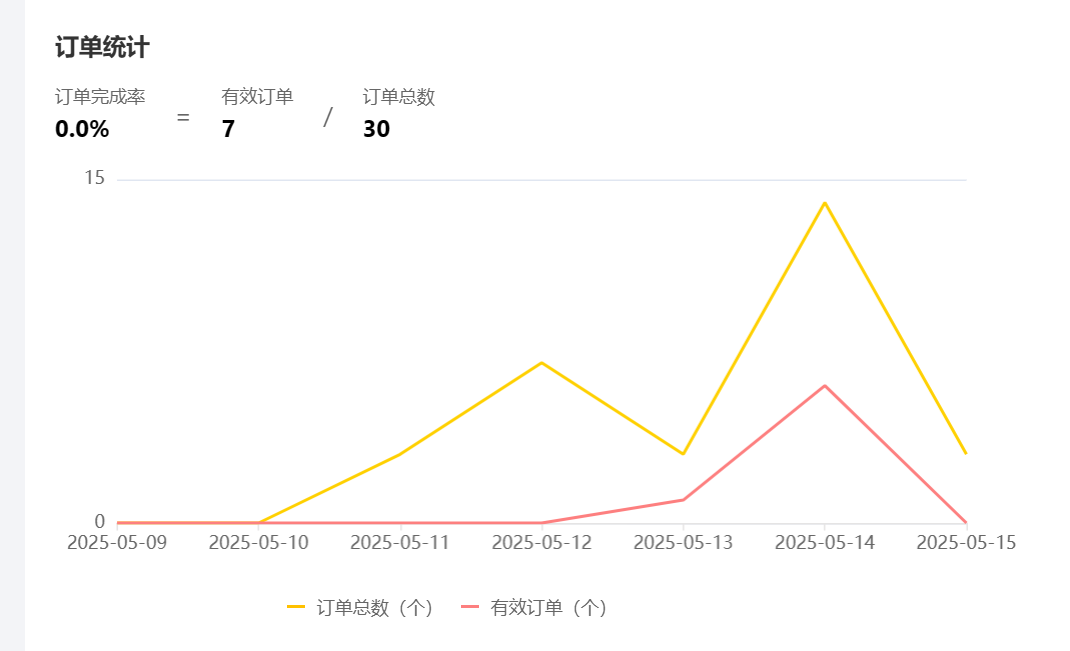
4.订单统计
需求分析
业务规则:
- 有效订单指状态为 “已完成” 的订单
- 基于可视化报表的折线图展示订单数据,X轴为日期,Y轴为订单数量
- 根据时间选择区间,展示每天的订单总数和有效订单数
- 展示所选时间区间内的有效订单数、总订单数、订单完成率,订单完成率 = 有效订单数 / 总订单数 * 100%
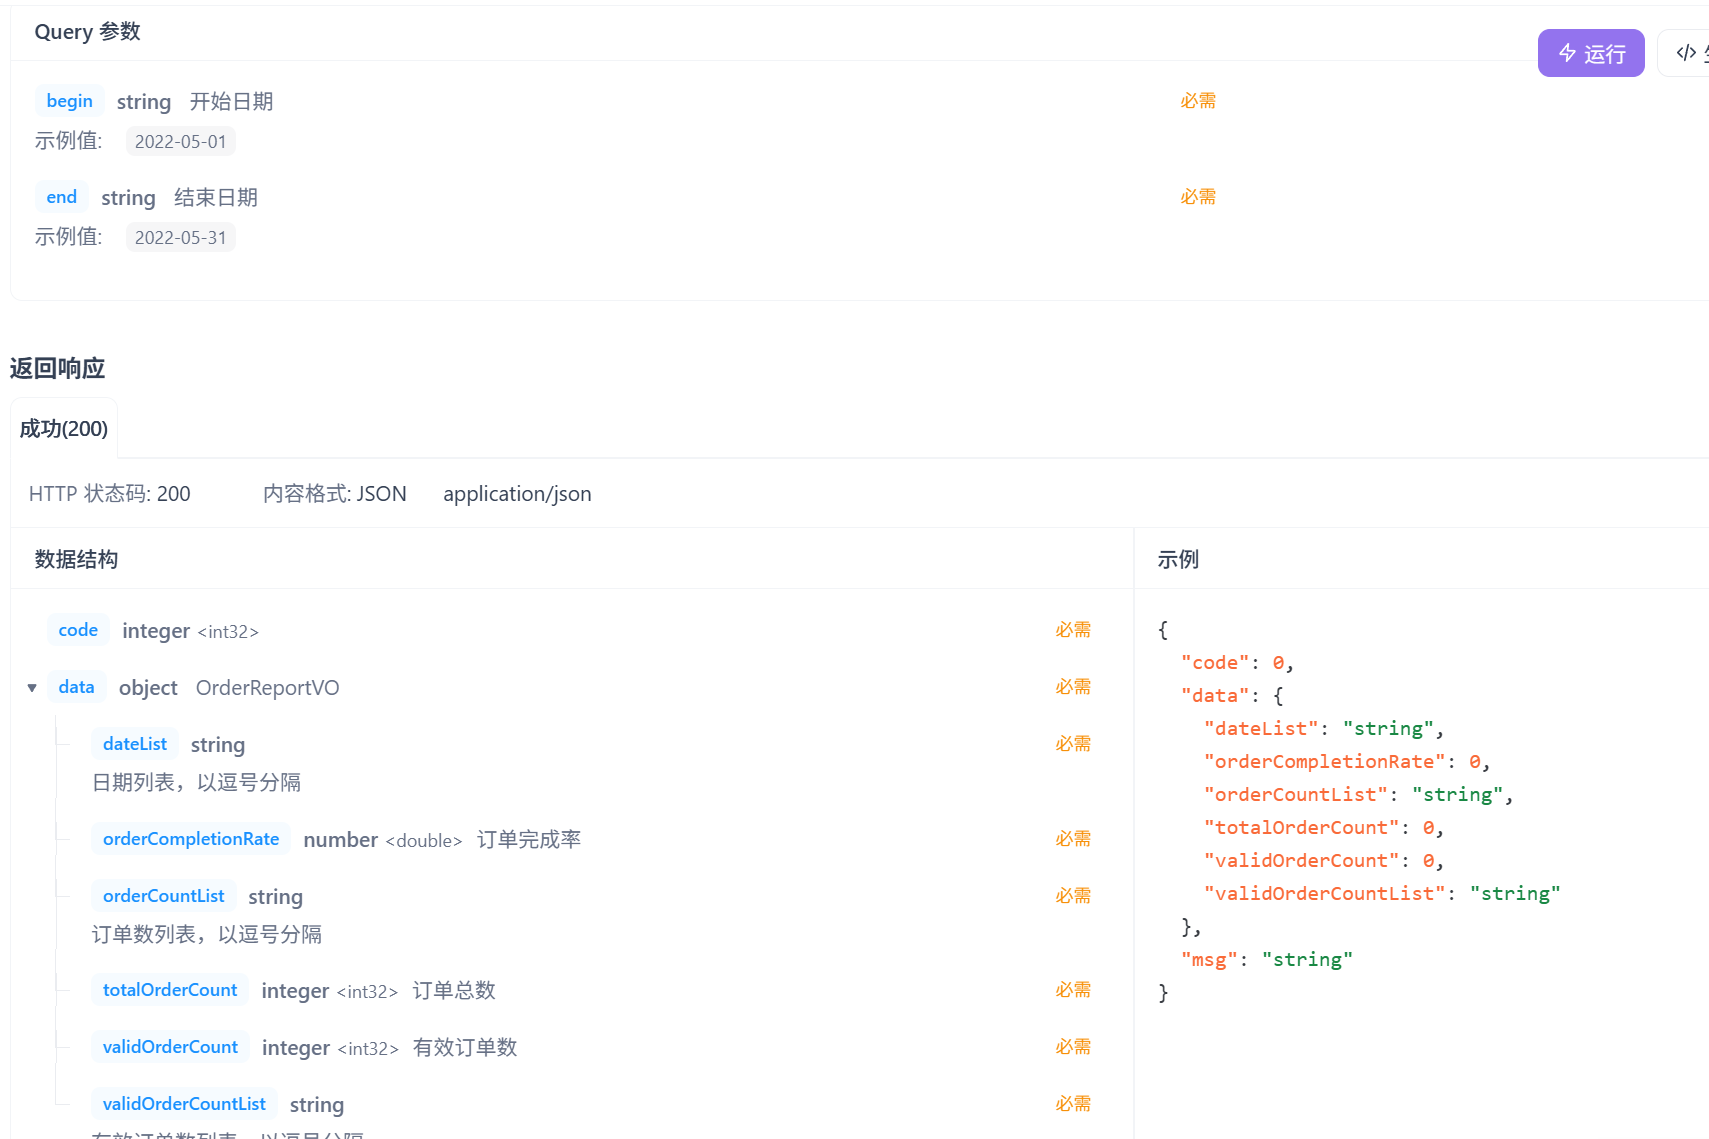
跟上两个接口传入参数返回数据格式上是一致的,请求参数是开始时间和结束时间,传给前端的orderCountList和validOrderCountList都要是String类型的数据
代码展示
Controller层
/**
 * 订单统计接口
 * @param begin
 * @param end
 * @return
 */
@ApiOperation("订单统计接口")
@GetMapping("/ordersStatistics")
public Result<OrderReportVO> orderStatistics(
        @DateTimeFormat(pattern = "yyyy-MM-dd") LocalDate begin,
        @DateTimeFormat(pattern = "yyyy-MM-dd") LocalDate end
){
    log.info("订单统计接口{},{}", begin, end);
    OrderReportVO orderReportVO = reportService.orderStatistics(begin, end);
    return Result.success(orderReportVO);
}
这里注意begin,end是LocalData变量,传入的时候要指定时间格式
service层
具体执行逻辑:
1.先是定义三个arrayList容器,分别用于储存每日的日期,每日的订单数,以及有效订单数
2.再定义两个total(Integer),用来统计订单总数和有效订单总数
3.while循环储存从开始(begin)到结束(end)的每一天日期数据
4.将每一天的日期数据(LocalData变量)转换成(LocalDataTime变量),分别取极小值(00:00:00)和极大值(23:59:5999)
4.调用Ordermapper,执行如下SQL语句:
select count(id) from Orders where order_time > beginTime(一天的极小值) and order_time < endTime(一天的极大值) and status = 5(已完成->当统计有效订单再传入相应参数)
每统计一天的,加入相应的容器和总数中
注意下这里传给mapper的数据是由map储存的
/**
 * 订单统计
 * @param begin
 * @param end
 * @return
 */
@Override
public OrderReportVO orderStatistics(LocalDate begin, LocalDate end) {
    List<LocalDate> dateList = new ArrayList<>();
    dateList.add(begin);
    while(!begin.equals(end)) {
        begin = begin.plusDays(1);
        dateList.add(begin);
    }

    List<Integer> orderCountList = new ArrayList<>();
    Integer totalOrderCount = 0;
    List<Integer> vaildOrderCountList = new ArrayList<>();
    Integer VaildOrderCount = 0;

    for(LocalDate date : dateList) {
        LocalDateTime beginTime = LocalDateTime.of(date, LocalTime.MIN);
        LocalDateTime endTime = LocalDateTime.of(date, LocalTime.MAX);
        Map map = new HashMap();
        map.put("beginTime", beginTime);
        map.put("endTime", endTime);
        Integer orderCount = orderMapper.CountByMap(map);
        orderCountList.add(orderCount);
        totalOrderCount += orderCount;
        map.put("status",Orders.COMPLETED);
        Integer vaildCount = orderMapper.CountByMap(map);
        vaildOrderCountList.add(vaildCount);
        VaildOrderCount += vaildCount;
    }

    return OrderReportVO.builder()
            .orderCountList(StringUtils.join(orderCountList, ","))
            .totalOrderCount(totalOrderCount)
            .validOrderCount(VaildOrderCount)
            .validOrderCountList(StringUtils.join(vaildOrderCountList, ","))
            .dateList(StringUtils.join(dateList,","))
            .build();
}
mapper层
<select id="CountByMap" resultType="java.lang.Integer">
select count(id) from orders
<where>
<if test="beginTime != null">
and order_time > #{beginTime}
</if>
<if test="endTime != null">
and order_time < #{endTime}
</if>
<if test="status != null">
and status = #{status}
</if>
</where>
</select>
运行展示:
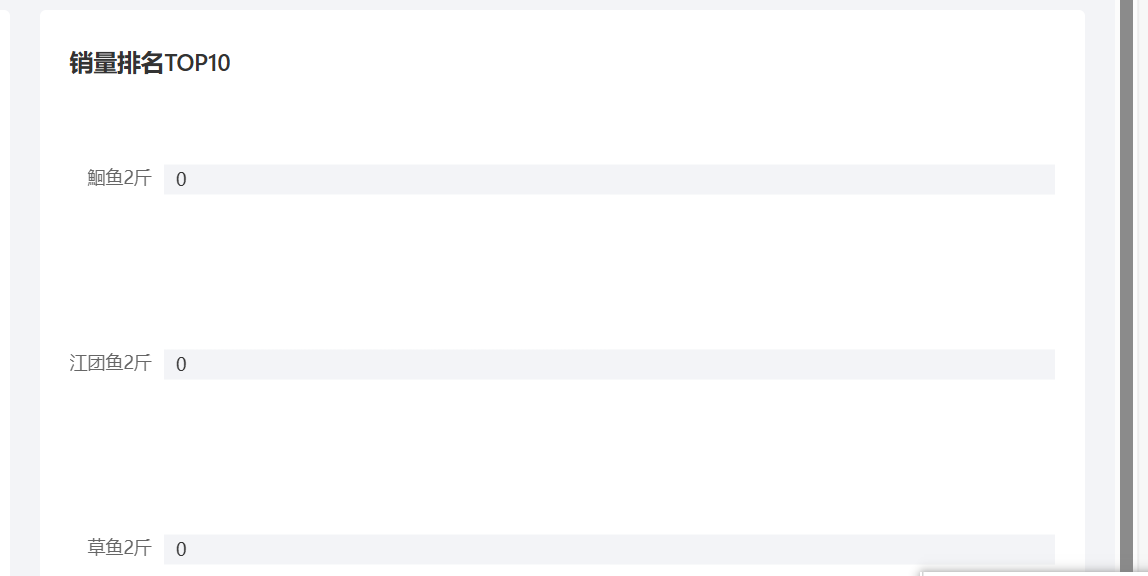
5. 销量排行统计
需求分析:
业务规则:
- 根据时间选择区间,展示销量前10的商品(包括菜品和套餐)
- 基于可视化报表的柱状图降序展示商品销量
- 此处的销量为商品销售的份数
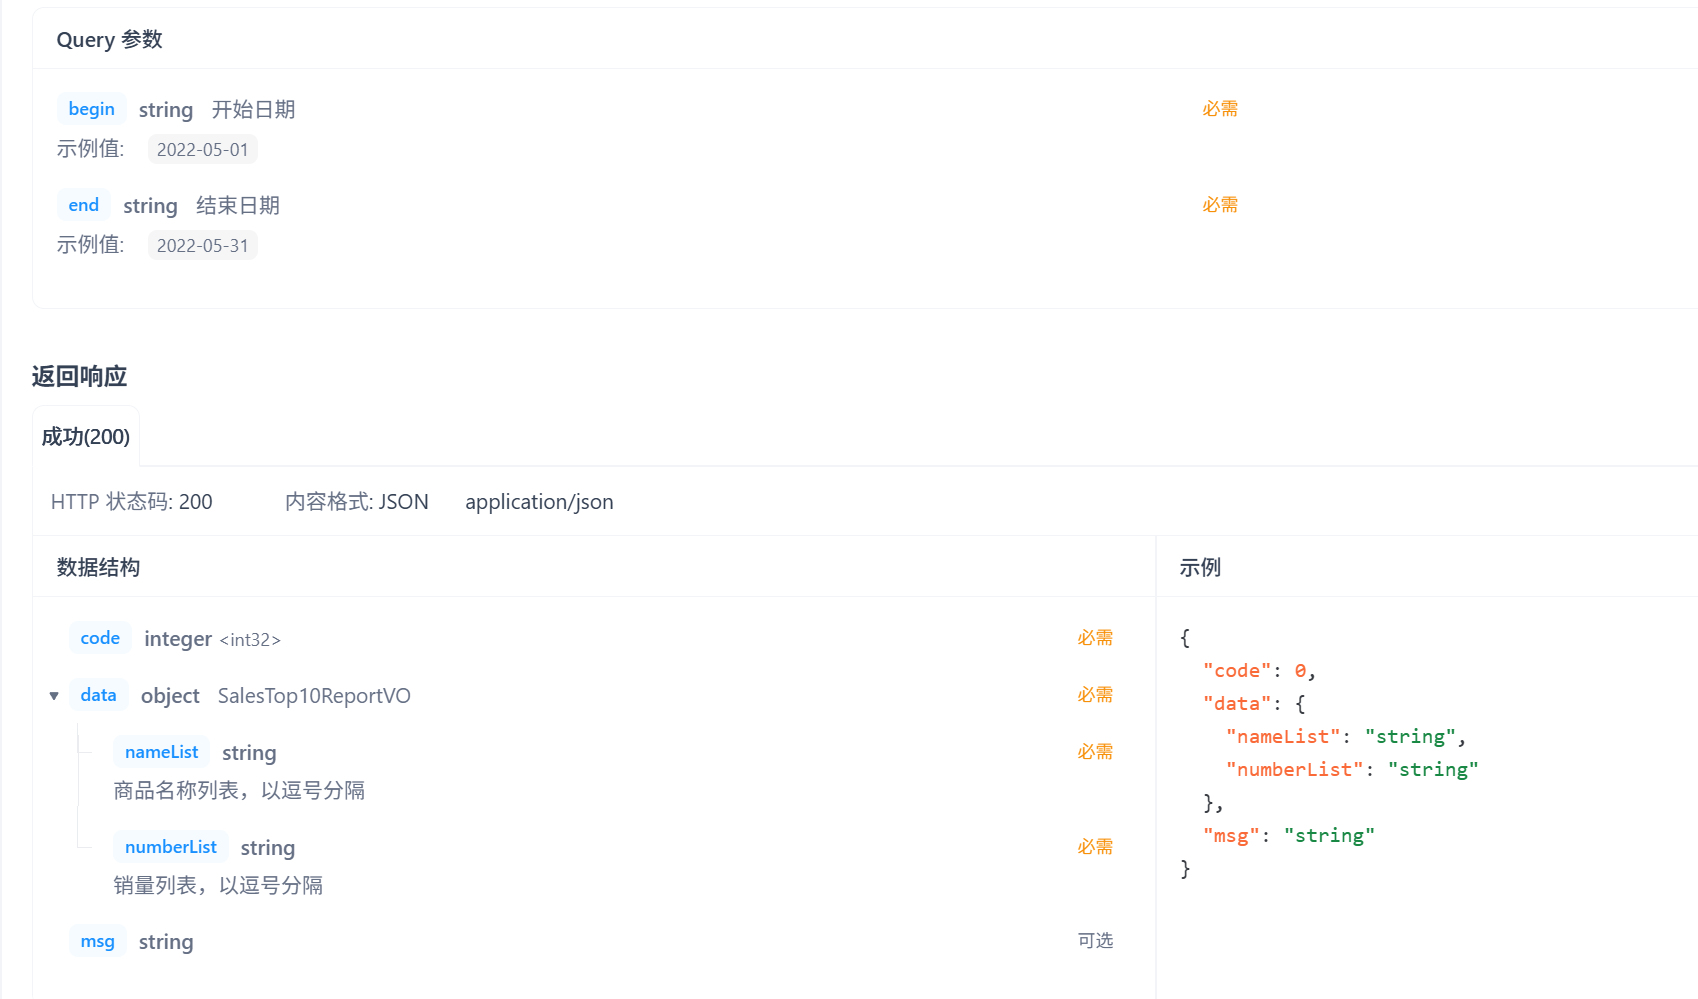
请求参数是开始时间和结束时间,这里注意传给前端的nameList和numberList都要是String类型的数据
代码展示:
controller层
/**
 * 销量排行展示
 * @param begin
 * @param end
 * @return
 */
@ApiOperation("销量排名展示")
@GetMapping("/top10")
public Result<SalesTop10ReportVO> salesTop10Statistics(
        @DateTimeFormat(pattern = "yyyy-MM-dd") LocalDate begin,
        @DateTimeFormat(pattern = "yyyy-MM-dd") LocalDate end
){
    log.info("销量排名展示{},{}", begin,end);
    SalesTop10ReportVO salesTop10ReportVO = reportService.top10(begin, end);
    return Result.success(salesTop10ReportVO);
}
这里注意begin,end是LocalData变量,传入的时候要指定时间格式
service层:
具体实现逻辑:
1.这里我们项目有一个专门封装了菜品名称和菜品销量的dto(GoodsSalesDTO),所以我们不用专门再创建容器去记录数据
2.因为销量统计是统计我们这一整段时间(从begin到end)的菜品销量,所以不用在遍历每一天的订单数据
3.将LocalDate变量数据转换成LocalDataTime,求得这一段时间的极小值和极大值
4.调用ordermapper,因为涉及到订单(orders)的下单时间和订单详情(order_detail)的菜品数据,所以这里我采用join进行连接查询,具体SQL语句为:
select od.name as name , coount(od.name) as number from orders o join order_detail od
on od.order_id = o.id
where status = 5(查看已下单的数据) and order_time > beginTime and order_time < endTime
group by name order by name desc limit 0, 10(查询销量前十的菜品)
5.得到相应的数据后使用stream流进行遍历,最后用StringUtils.join连接起来
/**
 * 销量统计
 * @param begin
 * @param end
 * @return
 */
@Override
public SalesTop10ReportVO top10(LocalDate begin, LocalDate end) {
    LocalDateTime beginTime = LocalDateTime.of(begin, LocalTime.MIN);
    LocalDateTime endTime = LocalDateTime.of(end, LocalTime.MAX);

    List<GoodsSalesDTO> goodsSalesDTOList = orderMapper.getByNameNum(beginTime, endTime);

    String nameList = StringUtils.join(goodsSalesDTOList.stream().map(GoodsSalesDTO::getName).collect(Collectors.toList()), ",");

    String numList = StringUtils.join(goodsSalesDTOList.stream().map(GoodsSalesDTO::getNumber).collect(Collectors.toList()), ",");


    return SalesTop10ReportVO.builder()
            .nameList(nameList)
            .numberList(numList)
            .build();
}
mapper层
<select id="getByNameNum" resultType="com.sky.dto.GoodsSalesDTO">
select od.name as name, sum(od.name) as number from orders o join order_detail od
on o.id = od.order_id
and o.status = 5
<where>
<if test="beginTime != null">
and order_time > #{beginTime}
</if>
<if test="endTime != null">
and order_time < #{endTime}
</if>
</where>
group by name
order by number desc
limit 0, 10
</select>
运行展示:
最后:
今天的分享就到这里。如果我的内容对你有帮助,请点赞,评论,收藏。创作不易,大家的支持就是我坚持下去的动力!(๑`・ᴗ・´๑)