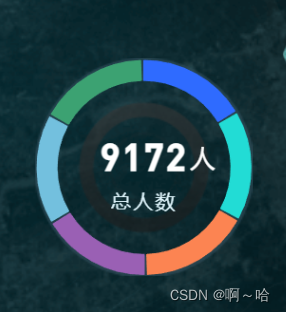
在饼图制作中遇到了一个难点就是饼图中间是分散的 试了很多方法,最后选择了给每个值中间再加一节的处理方式,并把颜色设置为透明就能达到相同效果。
处理后的样式:
代码:
      let list = this.data.list;/饼图内部展示数据
      // let _this = this;//存储当前this
      let total = Math.max(...list.map(item => item.value));
      let gap = total * (12 / 360);//通过计算得出间隔值
      this.myChart1 = echarts.init(this.$refs["chart-pie"]);
      let data = [];
      for (var i = 0; i < list.length; i++) {
        data.push(
          {
            value: list[i].value,
            name: list[i].name,
            itemStyle: {
              normal: {
                borderColor: this.color[i],
                color: this.color[i]
              }
            }
          },
          {
            value: gap,//间隔值
            name: "",
            itemStyle: {
              normal: {
                label: {
                  show: false
                },
                labelLine: {
                  show: false
                },
                color: "rgba(0, 0, 0, 0)",
                borderColor: "rgba(0, 0, 0, 0)",//间隔颜色设置为透明
                borderWidth: 0
              }
            },
            emphasis: {
              label: {
                show: false
              }
            }
          }
        );
      }
完整代码:
<template>
  <!-- 柱状图 -->
  <div class="ticket public-row">
    <div class="echarts-left fl">
      <div class="mychart" :class="{ 'fix-position': data.list.length > 5 }" :id="chartId" ref="chart-pie"></div>
    </div>
    <div class="text-right fl">
      <div
        class="text-right-item c-p"
        :class="{ acitve: active === index }"
        @click="changeText(index)"
        v-for="(item, index) in data.list"
        :key="index"
      >
        <div class="text-color fl" :class="'color' + index"></div>
        <div class="text-right-item-title fl">{{ item.name }}</div>
        <div class="text-right-item-num fl">{{ item.value }}</div>
        <div class="text-border fl"></div>
        <div class="text-right-item-type">{{ item.mixins }}</div>
      </div>
    </div>
  </div>
  <!-- <p v-else class="m-t20 m-l20">暂无数据</p> -->
</template>

<script>
let dashedPic = require("./img/huanxingtu.png");
export default {
  name: "base-pie",
  components: {},
  props: {
    chartId: {
      type: String,
      default: "chartId2"
    },
    data: {
      type: Object,
      default() {
        return {
          data: [
            { name: "OTA", value: 3124, mixins: "28%" },
            { name: "窗口", value: 3124, mixins: "28%" },
            { name: "小程序", value: 3124, mixins: "28%" },
            { name: "旅行社", value: 3124, mixins: "28%" }
          ],
          number: 9000,
          name: "总票数",
          unit: "张"
        };
      }
    },
    color: {
      type: Array,
      default() {
        return [
          "rgba(47, 107, 255, 1)",
          "rgba(34, 220, 213, 1)",
          "#FC8452",
          "#9A60B4",
          "#73C0DE",
          "#3CA272",
          "#ea7ccc"
        ];
      }
    },

    //显示样式
    typeId: {
      type: Number,
      default: 0
    }
  },
  data() {
    return {
      myChart1: "",
      active: 0
    };
  },
  created() {},
  mounted() {
    this.$nextTick(() => {
      // setTimeout(() => {
      // debugger;
      this.init();
      // }, 500);
    });
  },
  watch: {
    data: {
      handler() {
        this.$nextTick(() => {
          this.init();
        });
      },
      deep: true
    }
  },
  beforeDestroy() {},
  computed: {},
  methods: {
    /**
     * @description:选中切换
     * @param {*} item
     * @Description:
     * @return {*}
     */

    changeText(item) {
      this.active = item;
    },
    /**
     * @description:init 初始化
     * @param {*} item
     * @Description:
     * @return {*}
     */
    init() {
      if (this.myChart1) this.myChart1.dispose();
      if (!this.data) return false;
      let list = this.data.list;
      console.log(list);
      // let _this = this;
      let total = Math.max(...list.map(item => item.value));
      let gap = total * (12 / 360);
      this.myChart1 = echarts.init(this.$refs["chart-pie"]);
      let data = [];
      for (var i = 0; i < list.length; i++) {
        data.push(
          {
            value: list[i].value,
            name: list[i].name,
            itemStyle: {
              normal: {
                borderColor: this.color[i],
                color: this.color[i]
              }
            }
          },
          {
            value: gap,
            name: "",
            itemStyle: {
              normal: {
                label: {
                  show: false
                },
                labelLine: {
                  show: false
                },
                color: "rgba(0, 0, 0, 0)",
                borderColor: "rgba(0, 0, 0, 0)",
                borderWidth: 0
              }
            },
            emphasis: {
              label: {
                show: false
              }
            }
          }
        );
      }

      let option = {
        backgroundColor: "",
        title: [
          {
            text: this.data.number,
            top: "35%",
            left: "center",
            textStyle: {
              fontSize: 26,
              fontFamily: "DIN",
              color: "#ffffff"
            },
            subtext: this.data.name,
            // subtext: "总票数",
            subtextStyle: {
              fontSize: 14,
              color: "rgba(223, 245, 252, 1)"
            }
          },
          {
            text: this.data.unit,
            top: "38%",
            textAlign: "center",
            left: "74%",
            textStyle: {
              color: "rgba(255, 255, 255, 1)",
              fontSize: 18,
              fontWeight: "400"
            }
          }
        ],
        tooltip: {
          trigger: "axis",
          backgroundColor: "rgba(9, 30, 60, 0.6)",
          extraCssText: "box-shadow: 0 0 8px rgba(0, 128, 255, 0.27) inset;",
          borderWidth: 0,
          confine: false,
          appendToBody: true,
          textStyle: {
            color: "#fff",
            fontSize: 10
          }
        },
        legend: null,
        // 可动态生成颜色集合
        // color: this.color,
        series: [
          {
            name: "项目规模占比",
            type: "pie",
            radius: ["80%", "98%"],
            label: {
              show: false
            },
            data: data
          }
        ],
        graphic: {
          elements: [
            {
              itemStyle: {
                opacity: 0.8 // 设置整个系列的数据点的透明度
              },
              type: "image",
              style: {
                image: dashedPic,
                width: 154,
                height: 154,
                opacity: 0.6
              },
              left: "center",
              top: "center"
            }
          ]
        }
      };

      this.myChart1.setOption(option);
    }
  }
};
</script>

<style lang="less" scoped>
.mychart {
  width: 100%;
  height: 100%;
}
.ticket {
  overflow: hidden;
  font-size: 16px;
  display: flex;
  justify-content: center;
  align-items: center;
  .echarts-left {
    margin-top: 16px;
    width: 153px;
    height: 153px;
  }
  .text-right {
    margin-left: 21px;
    // margin-top: 30px;
    .text-right-item {
      width: 226px;
      margin-bottom: 10px;
      line-height: 24px;
      height: 24px;
    }
    .acitve {
      background: url(./img/xuanzhong.png) no-repeat;
    }
    .text-color {
      width: 3px;
      height: 16px;
      line-height: 16px;
      margin-right: 8px;
      margin-left: 13px;
      margin-top: 4px;
    }
    .text-right-item-title {
      width: 72px;
      font-size: 14px;
    }
    .color0 {
      background: radial-gradient(#a1ffb6 0%, #c7fff5 100%);
    }
    .color1 {
      background: radial-gradient(#7ab8ff 0%, #c7fff5 100%);
    }
    .color2 {
      background: radial-gradient(#a1ffb6 0%, #c7fff5 100%);
    }
    .color3 {
      background: radial-gradient(#a1ffb6 0%, #c7fff5 100%);
    }
    .text-border {
      width: 1px;
      height: 14px;
      margin: 4px 12px 0;
      border-right: 1px solid rgba(255, 255, 255, 0.4);
    }
  }
  .fix-position {
    top: -25px;
  }
}
</style>