既然要排查,就得有死锁:
① 本文先来个死锁现场,更有助于没接触过死锁的朋友切身实践下;
② 然后通过命令 SHOW ENGINE INNODB STATUS 分析事务和锁的状态;
③ 最后使用 INFORMATION_SCHEMA 下三张表(MEMORY引擎)更简单的监控问题;
④ 命令show full processlist 也会提及。
理论是基石、实战是产物,相信看完定有所得 😊。
目录
2. show engine innodb status 命令
1、死锁现场
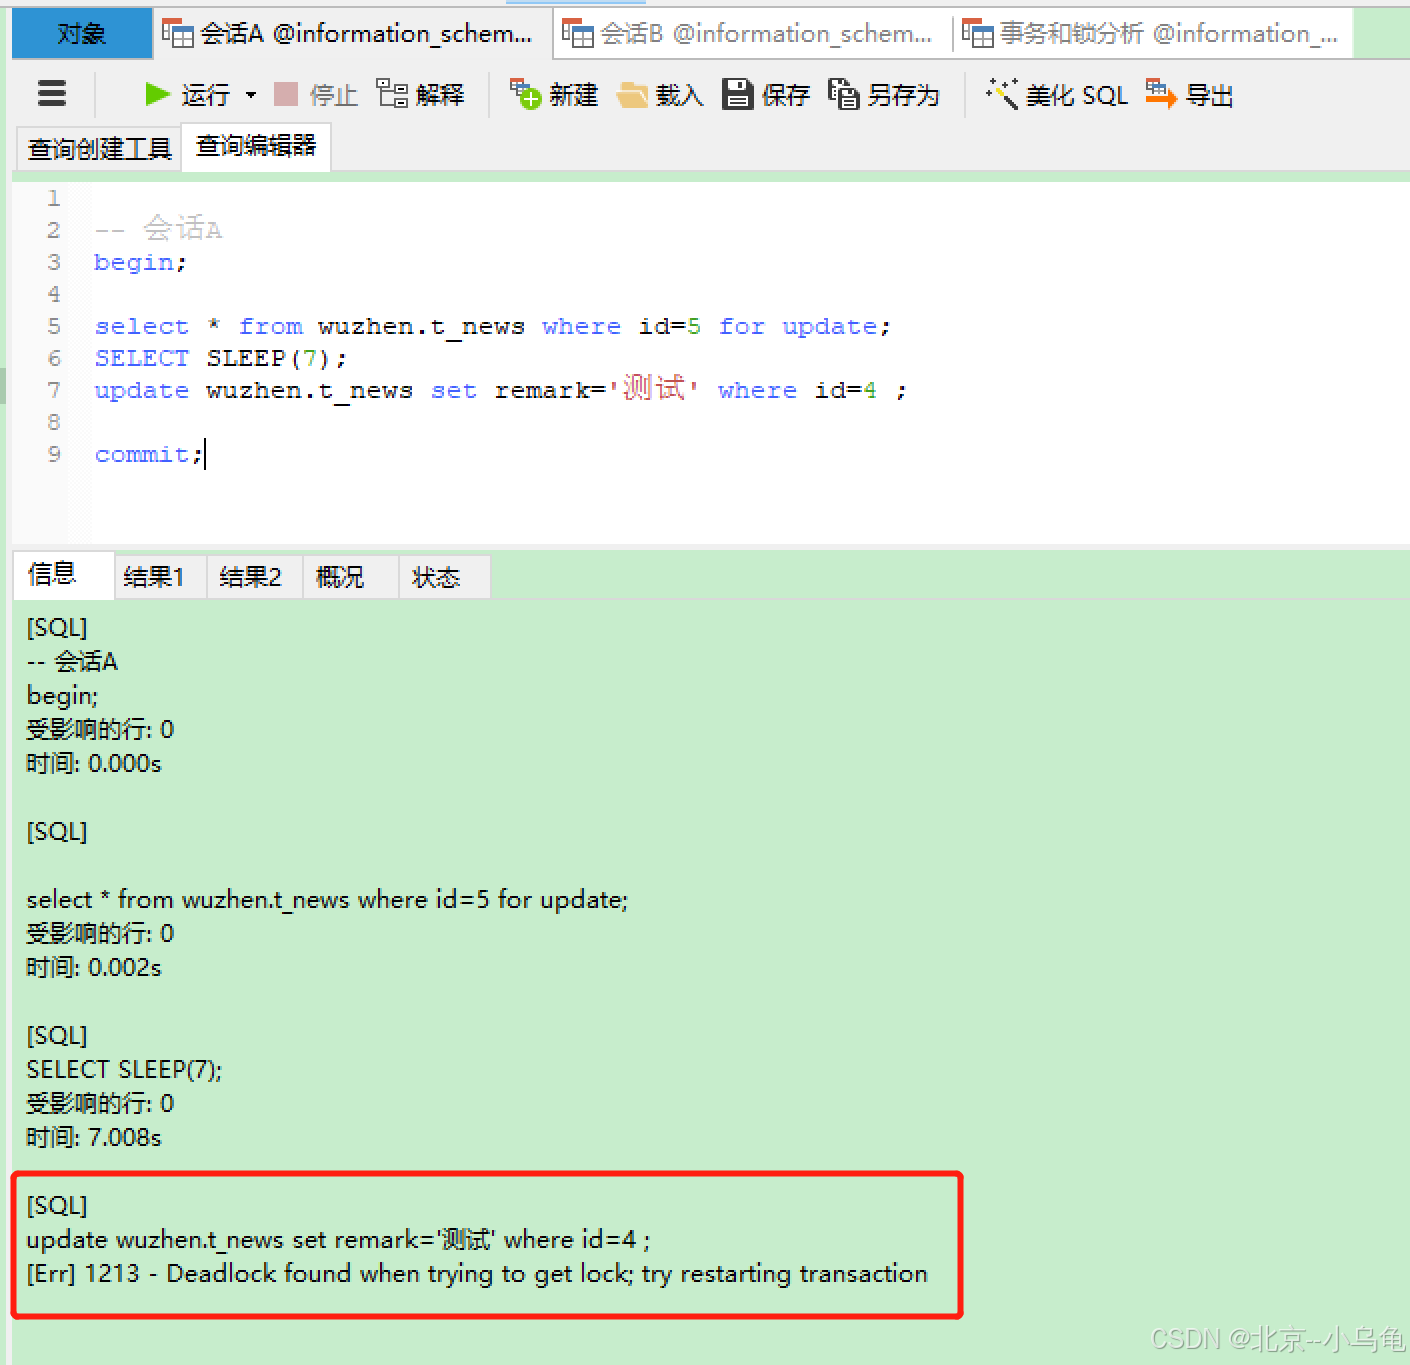
还是基于Mysql 5.7 ,在Navicat中打开两个查询窗口,会话A、B,然后依次执行,代码如下:
-- 会话A
begin;

select * from wuzhen.t_news where id=5 for update;
SELECT SLEEP(7);
update wuzhen.t_news set remark='测试' where id=4 ;

commit;
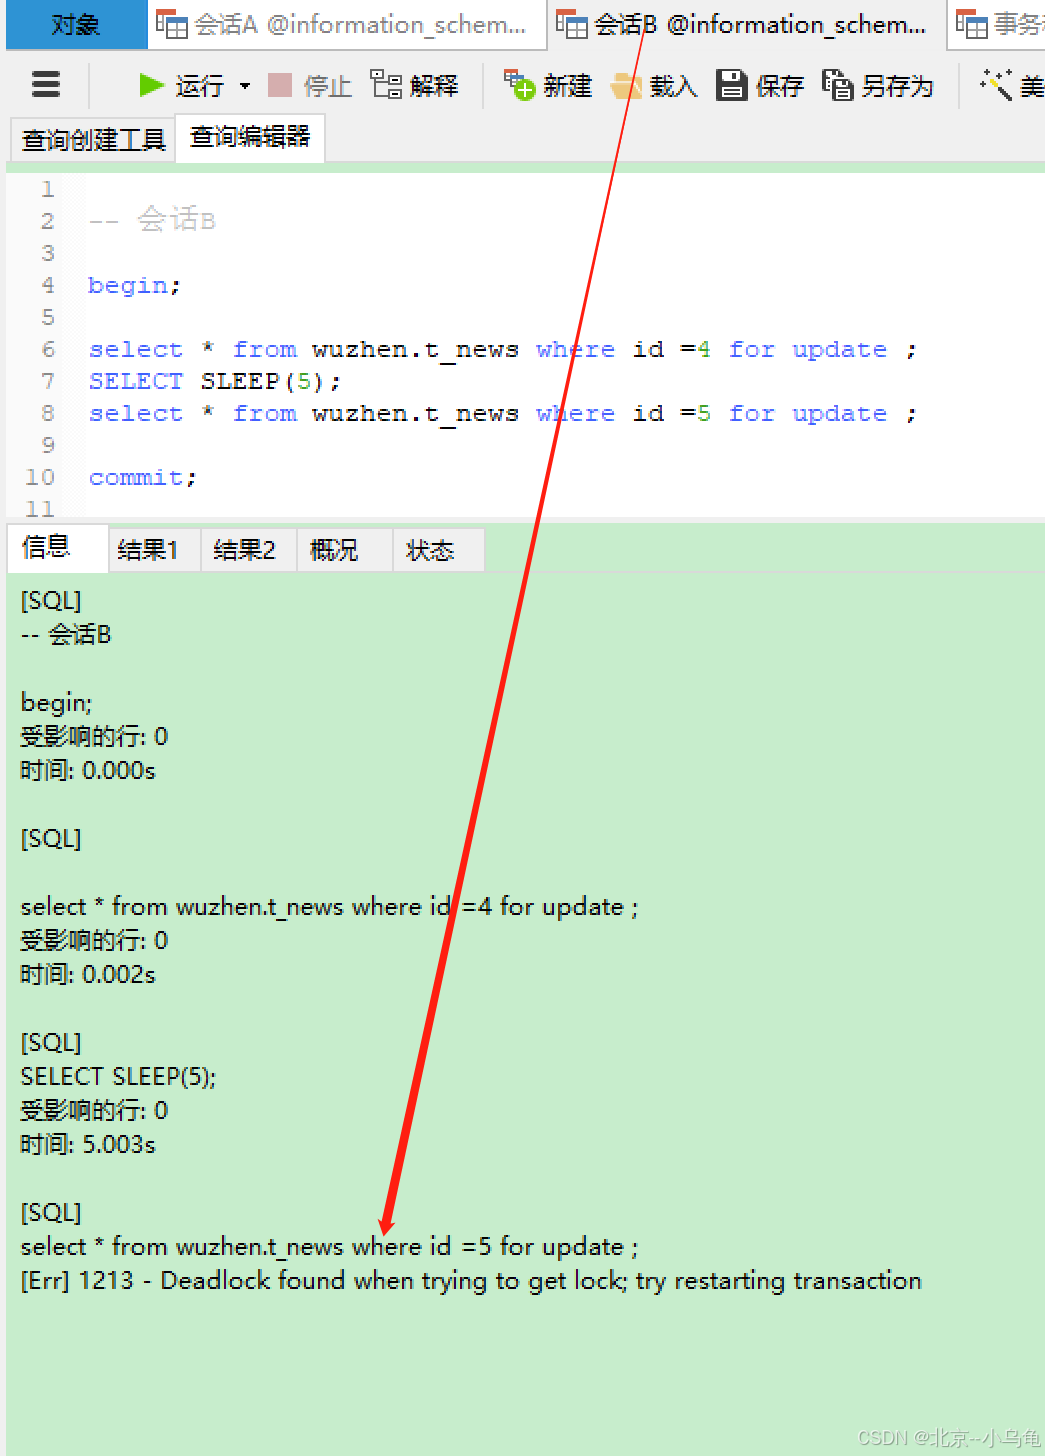
-- 会话B

begin;

select * from wuzhen.t_news where id =4 for update ;
SELECT SLEEP(5);
select * from wuzhen.t_news where id =5 for update ;

commit;
会话A、B中存在经典的AB-BA死锁。会话A被回滚,而B得以正常执行,如图:
题外话:
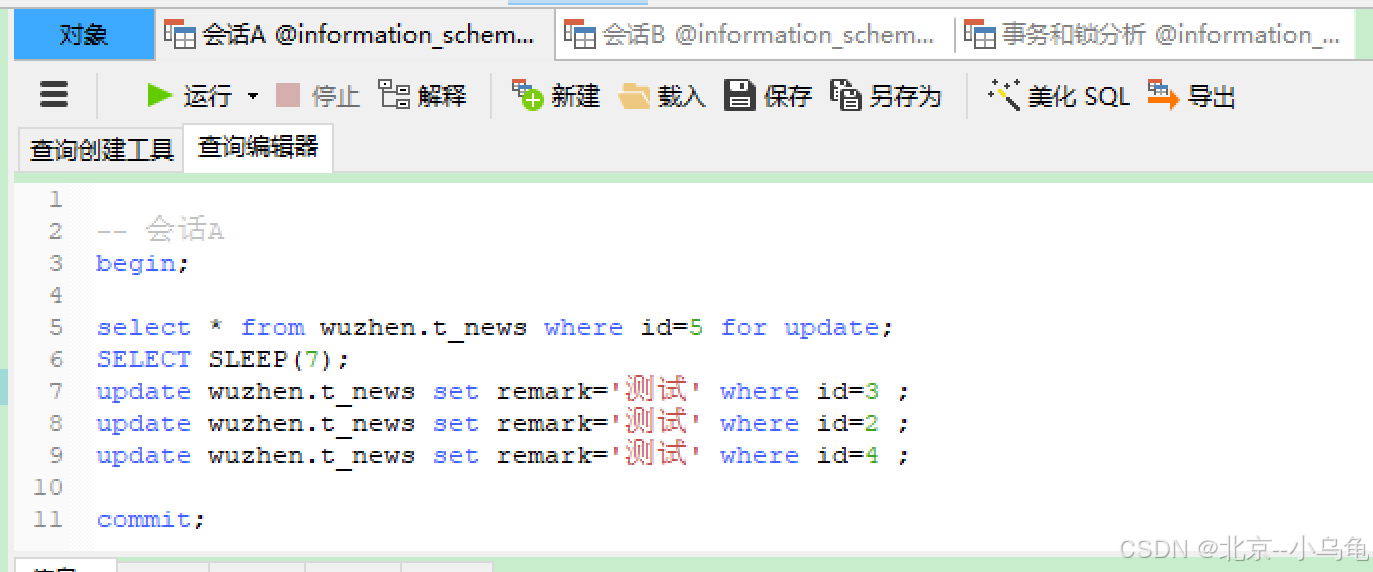
InnoDB在检测到死锁时,将会基于成本评估策略(本文3.1小节有提及)选择回滚谁;
如果我们在会话A的update前再加俩不存在行锁竞争的update,大概率会回滚会话B,上图
2. show engine innodb status 命令
该命令诚如中文直译:展示InnoDB存储引擎状态。
它不仅有事务和锁的相关信息,还包含后台线程、日志、缓冲池及内存、行操作等关键信息,可以基于这些指标值进行评估和优化。
简单说下该日志的格式,两个分隔线中间是标题,其下就是具体详情。
------------------------
LATEST DETECTED DEADLOCK # 标题
------------------------
XXXXXX # 具体详情
完整日志附在下面,我们分析下该命令有关死锁(最近检测到的死锁)的信息:
- 检测时间:
2025-01-17 13:07:44 0x580:此为死锁被检测到的时间戳。 - 事务信息
事务 (1):
基本信息:
TRANSACTION 139617, ACTIVE 6 sec starting index read:事务编号为 139617,已经处于活动状态 6 秒,正在开始索引读取操作。mysql tables in use 1, locked 1:该事务正在使用 1 个 MySQL 表,并且锁定了 1 个表。LOCK WAIT 3 lock struct(s), heap size 1136, 2 row lock(s):处于锁等待状态,包含 3 个锁结构,堆大小为 1136,有 2 个行锁。MySQL thread id 106, OS thread handle 10868, query id 11590 localhost 127.0.0.1 root statistics:事务运行在 MySQL 线程 106 上,操作系统线程句柄是 10868,查询 ID 为 11590,由本地的 root 用户发起,该事务正在进行统计操作。
操作及锁等待信息:
select * from wuzhen.t_news where id =5 for update:该事务正在执行一个SELECT查询操作,并且使用了FOR UPDATE子句,这意味着它会对查询结果集的行进行加锁,以防止其他事务修改这些行。*** (1) WAITING FOR THIS LOCK TO BE GRANTED::显示该事务正在等待锁的授予。RECORD LOCKS space id 339 page no 16 n bits 80 index PRIMARY of table 'wuzhen'.'t_news' trx id 139617 lock_mode X locks rec but not gap waiting:具体说明该事务正在等待wuzhen.t_news表 PRIMARY 索引上的锁,锁模式是X locks rec but not gap waiting,即排它锁,锁定记录但不锁定间隙,并且处于等待状态。同时提供了该记录的物理记录信息,包括多个字段的长度、十六进制数据及部分可解析的字符内容,这些信息可用于进一步的深入分析。
事务 (2):
基本信息:
TRANSACTION 139616, ACTIVE 7 sec starting index read事务编号为 139616,已经处于活动状态 7 秒,正在开始索引读取操作。mysql tables in use 1, locked 1:使用 1 个 MySQL 表并锁定 1 个表。3 lock struct(s), heap size 1136, 2 row lock(s):具有 3 个锁结构,堆大小为 1136,有 2 个行锁。MySQL thread id 105, OS thread handle 1408, query id 11591 localhost 127.0.0.1 root updating:该事务运行在 MySQL 线程 105 上,操作系统线程句柄是 1408,查询 ID 为 11591,由本地的 root 用户发起,正在进行更新操作。
操作及锁信息:
update wuzhen.t_news set remark='测试' where id=4:该事务正在执行一个更新操作,将wuzhen.t_news表中id = 4的行的remark字段更新为测试。*** (2) HOLDS THE LOCK(S)::显示该事务持有的锁信息。RECORD LOCKS space id 339 page no 16 n bits 80 index PRIMARY of table 'wuzhen'.'t_news' trx id 139616 lock_mode X locks rec but not gap:持有wuzhen.t_news表 PRIMARY 索引上的锁,锁模式是X locks rec but not gap,即排它锁,锁定记录但不锁定间隙。同样给出了持有锁的记录的物理记录信息,部分与事务 (1) 等待锁的记录信息重叠,说明二者涉及对相同部分数据的操作。*** (2) WAITING FOR THIS LOCK TO BE GRANTED::显示该事务也在等待另一个锁。RECORD LOCKS space id 339 page no 16 n bits 80 index PRIMARY of table 'wuzhen'.'t_news' trx id 139616 lock_mode X locks rec but not gap waiting:正在等待wuzhen.t_news表 PRIMARY 索引上的另一个锁,锁模式是X locks rec but not gap waiting,处于等待状态,并提供了相应记录的详细物理记录信息。
Mysql检测到死锁并解决
*** WE ROLL BACK TRANSACTION (2):系统检测到死锁后,决定回滚事务 (2) 【也就是死锁现场会话A中 1213异常】来解决死锁问题,以打破两个事务之间的相互等待状态。
InnoDB
=====================================
2025-01-17 13:07:48 0x1744 INNODB MONITOR OUTPUT
=====================================
Per second averages calculated from the last 1 seconds
-----------------
BACKGROUND THREAD
-----------------
srv_master_thread loops: 868 srv_active, 0 srv_shutdown, 58250 srv_idle
srv_master_thread log flush and writes: 59118
----------
SEMAPHORES
----------
OS WAIT ARRAY INFO: reservation count 675
OS WAIT ARRAY INFO: signal count 626
RW-shared spins 0, rounds 540, OS waits 238
RW-excl spins 0, rounds 1351, OS waits 13
RW-sx spins 11, rounds 150, OS waits 2
Spin rounds per wait: 540.00 RW-shared, 1351.00 RW-excl, 13.64 RW-sx
------------------------
LATEST DETECTED DEADLOCK
------------------------
2025-01-17 13:07:44 0x580
*** (1) TRANSACTION:
TRANSACTION 139617, ACTIVE 6 sec starting index read
mysql tables in use 1, locked 1
LOCK WAIT 3 lock struct(s), heap size 1136, 2 row lock(s)
MySQL thread id 106, OS thread handle 10868, query id 11590 localhost 127.0.0.1 root statistics
select * from wuzhen.t_news where id =5 for update
*** (1) WAITING FOR THIS LOCK TO BE GRANTED:
RECORD LOCKS space id 339 page no 16 n bits 80 index PRIMARY of table `wuzhen`.`t_news` trx id 139617 lock_mode X locks rec but not gap waiting
Record lock, heap no 6 PHYSICAL RECORD: n_fields 31; compact format; info bits 0
 0: len 8; hex 8000000000000005; asc         ;;
 1: len 6; hex 000000020ba5; asc       ;;
 2: len 7; hex a1000001120110; asc        ;;
 3: len 5; hex 9997db4a21; asc    J!;;
 4: len 1; hex 01; asc  ;;
 5: len 8; hex 80000151a3eb5c57; asc    Q  \W;;
 6: len 20; hex 000001530000000f00000026400000000000342b; asc    S       &@     4+;;
 7: len 30; hex 3c703e41732074686520686f7374206f6620746865205365636f6e642057; asc <p>As the host of the Second W; (total 2855 bytes);
 8: SQL NULL;
 9: len 30; hex 57757a68656e206765747320736d6172742077697468205365636f6e6420; asc Wuzhen gets smart with Second ; (total 55 bytes);
 10: SQL NULL;
 11: len 30; hex 41732074686520686f7374206f6620746865205365636f6e6420576f726c; asc As the host of the Second Worl; (total 117 bytes);
 12: len 30; hex e4b8ade59bbde4ba92e88194e7bd91e59586e4b89ae6a8a1e5bc8fe5889b; asc                               ; (total 63 bytes);
 13: len 27; hex e4ba92e88194e7bd91e59586e4b89ae6a8a1e5bc8fe5889be696b0; asc                            ;;
 14: len 4; hex 80000002; asc     ;;
 15: len 8; hex 8000000000000001; asc         ;;
 16: len 8; hex 8000000000000001; asc         ;;
 17: len 8; hex 8000000000000001; asc         ;;
 18: SQL NULL;
 19: len 1; hex 00; asc  ;;
 20: len 4; hex 800003e8; asc     ;;
 21: len 8; hex 80000000000041d2; asc       A ;;
 22: len 30; hex 2f75706c6f61642f6e6577732f3230313531323133303834303333313431; asc /upload/news/20151213084033141; (total 37 bytes);
 23: len 30; hex 2f75706c6f61642f6e6577732f3230313531323134303930343037323134; asc /upload/news/20151214090407214; (total 37 bytes);
 24: len 8; hex 8000000000000001; asc         ;;
 25: len 5; hex 9997db4a21; asc    J!;;
 26: SQL NULL;
 27: len 1; hex 32; asc 2;;
 28: SQL NULL;
 29: len 0; hex ; asc ;;
 30: SQL NULL;

*** (2) TRANSACTION:
TRANSACTION 139616, ACTIVE 7 sec starting index read, thread declared inside InnoDB 5000
mysql tables in use 1, locked 1
3 lock struct(s), heap size 1136, 2 row lock(s)
MySQL thread id 105, OS thread handle 1408, query id 11591 localhost 127.0.0.1 root updating
update wuzhen.t_news set remark='测试' where id=4
*** (2) HOLDS THE LOCK(S):
RECORD LOCKS space id 339 page no 16 n bits 80 index PRIMARY of table `wuzhen`.`t_news` trx id 139616 lock_mode X locks rec but not gap
Record lock, heap no 6 PHYSICAL RECORD: n_fields 31; compact format; info bits 0
 0: len 8; hex 8000000000000005; asc         ;;
 1: len 6; hex 000000020ba5; asc       ;;
 2: len 7; hex a1000001120110; asc        ;;
 3: len 5; hex 9997db4a21; asc    J!;;
 4: len 1; hex 01; asc  ;;
 5: len 8; hex 80000151a3eb5c57; asc    Q  \W;;
 6: len 20; hex 000001530000000f00000026400000000000342b; asc    S       &@     4+;;
 7: len 30; hex 3c703e41732074686520686f7374206f6620746865205365636f6e642057; asc <p>As the host of the Second W; (total 2855 bytes);
 8: SQL NULL;
 9: len 30; hex 57757a68656e206765747320736d6172742077697468205365636f6e6420; asc Wuzhen gets smart with Second ; (total 55 bytes);
 10: SQL NULL;
 11: len 30; hex 41732074686520686f7374206f6620746865205365636f6e6420576f726c; asc As the host of the Second Worl; (total 117 bytes);
 12: len 30; hex e4b8ade59bbde4ba92e88194e7bd91e59586e4b89ae6a8a1e5bc8fe5889b; asc                               ; (total 63 bytes);
 13: len 27; hex e4ba92e88194e7bd91e59586e4b89ae6a8a1e5bc8fe5889be696b0; asc                            ;;
 14: len 4; hex 80000002; asc     ;;
 15: len 8; hex 8000000000000001; asc         ;;
 16: len 8; hex 8000000000000001; asc         ;;
 17: len 8; hex 8000000000000001; asc         ;;
 18: SQL NULL;
 19: len 1; hex 00; asc  ;;
 20: len 4; hex 800003e8; asc     ;;
 21: len 8; hex 80000000000041d2; asc       A ;;
 22: len 30; hex 2f75706c6f61642f6e6577732f3230313531323133303834303333313431; asc /upload/news/20151213084033141; (total 37 bytes);
 23: len 30; hex 2f75706c6f61642f6e6577732f3230313531323134303930343037323134; asc /upload/news/20151214090407214; (total 37 bytes);
 24: len 8; hex 8000000000000001; asc         ;;
 25: len 5; hex 9997db4a21; asc    J!;;
 26: SQL NULL;
 27: len 1; hex 32; asc 2;;
 28: SQL NULL;
 29: len 0; hex ; asc ;;
 30: SQL NULL;

*** (2) WAITING FOR THIS LOCK TO BE GRANTED:
RECORD LOCKS space id 339 page no 16 n bits 80 index PRIMARY of table `wuzhen`.`t_news` trx id 139616 lock_mode X locks rec but not gap waiting
Record lock, heap no 5 PHYSICAL RECORD: n_fields 31; compact format; info bits 0
 0: len 8; hex 8000000000000004; asc         ;;
 1: len 6; hex 000000020ba3; asc       ;;
 2: len 7; hex c0000001350110; asc     5  ;;
 3: len 5; hex 9997db48d3; asc    H ;;
 4: len 1; hex 01; asc  ;;
 5: len 8; hex 80000151a32f546c; asc    Q /Tl;;
 6: len 30; hex 3c70207374796c653d2270616464696e673a203130707820313470782030; asc <p style="padding: 10px 14px 0; (total 3021 bytes);
 7: len 30; hex 3c70207374796c653d22746578742d616c69676e3a2063656e7465723b22; asc <p style="text-align: center;"; (total 2143 bytes);
 8: SQL NULL;
 9: len 30; hex 496e7465726e6574206d616b6573206c69666520696e2057757a68656e20; asc Internet makes life in Wuzhen ; (total 45 bytes);
 10: SQL NULL;
 11: len 30; hex 202020546865205365636f6e6420576f726c6420496e7465726e65742043; asc    The Second World Internet C; (total 198 bytes);
 12: len 30; hex e4b98ce99587e5b3b0e4bc9ae58092e8aea1e697b6efbc9ae68a80e69caf; asc                               ; (total 85 bytes);
 13: len 30; hex 202020e4b88ee4bc9ae59889e5aebee79a84e6898be69cbae4b88ae983bd; asc                               ; (total 151 bytes);
 14: len 4; hex 80000002; asc     ;;
 15: len 8; hex 8000000000000001; asc         ;;
 16: len 8; hex 8000000000000001; asc         ;;
 17: len 8; hex 8000000000000001; asc         ;;
 18: SQL NULL;
 19: len 1; hex 00; asc  ;;
 20: len 4; hex 800003e8; asc     ;;
 21: len 8; hex 80000000000041d2; asc       A ;;
 22: len 30; hex 2f75706c6f61642f6e6577732f3230313531323133303833353139343430; asc /upload/news/20151213083519440; (total 37 bytes);
 23: SQL NULL;
 24: len 8; hex 8000000000000001; asc         ;;
 25: len 5; hex 9997db48d3; asc    H ;;
 26: SQL NULL;
 27: len 1; hex 32; asc 2;;
 28: SQL NULL;
 29: len 0; hex ; asc ;;
 30: SQL NULL;

*** WE ROLL BACK TRANSACTION (2)
------------
TRANSACTIONS
------------
Trx id counter 139618
Purge done for trx's n:o < 139547 undo n:o < 0 state: running but idle
History list length 886
LIST OF TRANSACTIONS FOR EACH SESSION:
---TRANSACTION 283917367864224, not started
0 lock struct(s), heap size 1136, 0 row lock(s)
---TRANSACTION 283917367863352, not started
0 lock struct(s), heap size 1136, 0 row lock(s)
---TRANSACTION 283917367862480, not started
0 lock struct(s), heap size 1136, 0 row lock(s)
---TRANSACTION 283917367861608, not started
0 lock struct(s), heap size 1136, 0 row lock(s)
---TRANSACTION 283917367860736, not started
0 lock struct(s), heap size 1136, 0 row lock(s)
---TRANSACTION 283917367859864, not started
0 lock struct(s), heap size 1136, 0 row lock(s)
---TRANSACTION 283917367858992, not started
0 lock struct(s), heap size 1136, 0 row lock(s)
--------
FILE I/O
--------
I/O thread 0 state: wait Windows aio (insert buffer thread)
I/O thread 1 state: wait Windows aio (log thread)
I/O thread 2 state: wait Windows aio (read thread)
I/O thread 3 state: wait Windows aio (read thread)
I/O thread 4 state: wait Windows aio (read thread)
I/O thread 5 state: wait Windows aio (read thread)
I/O thread 6 state: wait Windows aio (write thread)
I/O thread 7 state: wait Windows aio (write thread)
I/O thread 8 state: wait Windows aio (write thread)
I/O thread 9 state: wait Windows aio (write thread)
Pending normal aio reads: [0, 0, 0, 0] , aio writes: [0, 0, 0, 0] ,
 ibuf aio reads:, log i/o's:, sync i/o's:
Pending flushes (fsync) log: 0; buffer pool: 0
1274 OS file reads, 3060 OS file writes, 810 OS fsyncs
0.00 reads/s, 0 avg bytes/read, 0.00 writes/s, 0.00 fsyncs/s
-------------------------------------
INSERT BUFFER AND ADAPTIVE HASH INDEX
-------------------------------------
Ibuf: size 1, free list len 0, seg size 2, 0 merges
merged operations:
 insert 0, delete mark 0, delete 0
discarded operations:
 insert 0, delete mark 0, delete 0
Hash table size 2267, node heap has 1 buffer(s)
Hash table size 2267, node heap has 0 buffer(s)
Hash table size 2267, node heap has 0 buffer(s)
Hash table size 2267, node heap has 1 buffer(s)
Hash table size 2267, node heap has 1 buffer(s)
Hash table size 2267, node heap has 1 buffer(s)
Hash table size 2267, node heap has 1 buffer(s)
Hash table size 2267, node heap has 1 buffer(s)
0.00 hash searches/s, 0.00 non-hash searches/s
---
LOG
---
Log sequence number 191113770
Log flushed up to   191113770
Pages flushed up to 191113770
Last checkpoint at  191113761
0 pending log flushes, 0 pending chkp writes
531 log i/o's done, 0.00 log i/o's/second
----------------------
BUFFER POOL AND MEMORY
----------------------
Total large memory allocated 8585216
Dictionary memory allocated 6473753
Buffer pool size   512
Free buffers       250
Database pages     256
Old database pages 0
Modified db pages  0
Pending reads 0
Pending writes: LRU 0, flush list 0, single page 0
Pages made young 0, not young 0
0.00 youngs/s, 0.00 non-youngs/s
Pages read 1224, created 124, written 2423
0.00 reads/s, 0.00 creates/s, 0.00 writes/s
No buffer pool page gets since the last printout
Pages read ahead 0.00/s, evicted without access 0.00/s, Random read ahead 0.00/s
LRU len: 256, unzip_LRU len: 0
I/O sum[3]:cur[0], unzip sum[0]:cur[0]
--------------
ROW OPERATIONS
--------------
0 queries inside InnoDB, 0 queries in queue
0 read views open inside InnoDB
Process ID=1372, Main thread ID=16148, state: sleeping
Number of rows inserted 14187, updated 1, deleted 117, read 19683
0.00 inserts/s, 0.00 updates/s, 0.00 deletes/s, 0.00 reads/s
----------------------------
END OF INNODB MONITOR OUTPUT
============================
3. 巧用 INFORMATION_SCHEMA
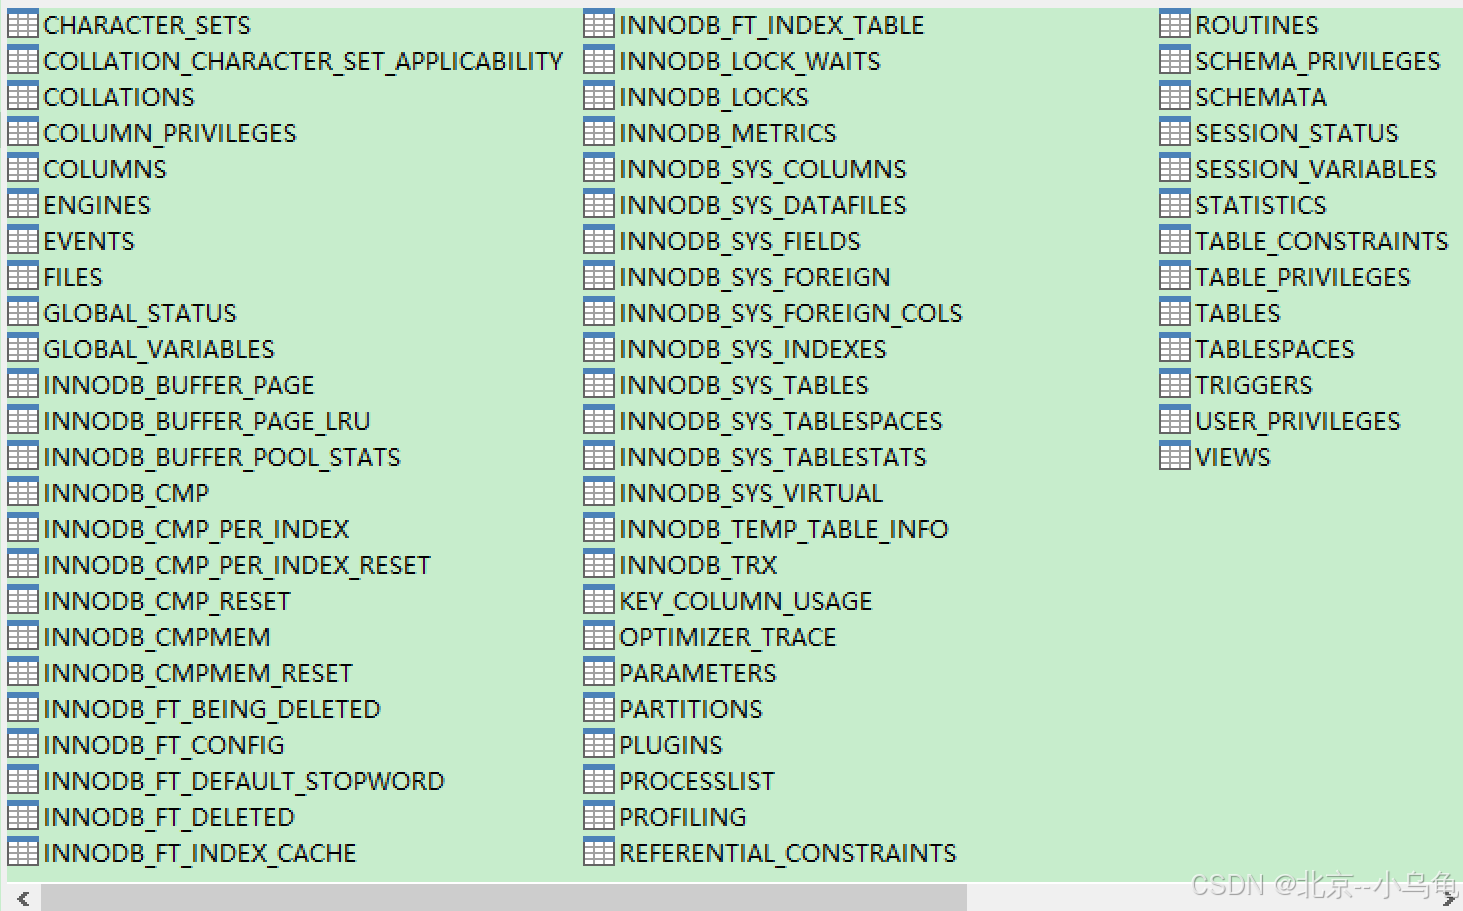
INFORMATION_SCHEMA 是 MySQL 提供的一个系统数据库,包含了其他数据库的结构、表、列、索引、权限、指标等元数据。
看表名就能猜个大概,针对事务的死锁或阻塞问题,我们只需要了解【INNODB_TRX】【INNODB_LOCK_WAITS】【INNODB_LOCKS】这三张表即可。
3.1 INNODB_TRX 表
该表储存了 InnoDB 当前正在运行的事务各种细节,包括事务的状态、使用的资源、锁信息以及事务的执行情况等。(表字段较多,个人认为较重要的用底色标识)
| 编号 | 字段名 | 说明 |
|---|---|---|
| 1 | trx_id |
事务的唯一标识符 |
| 2 | trx_state |
事务的当前状态,可能处于活动、提交、回滚等不同状态。 |
| 3 | trx_started |
事务开始的时间 |
| 4 | trx_requested_lock_id |
当事务正在等待锁时,此列会显示所请求锁的 ID。如trx_state不是Lock Wait该值为空 |
| 5 | trx_wait_started |
事务开始等待锁的时间 |
| 6 | trx_weight |
事务的权重,反映了一个事务修改和锁住的行数。当发生死锁需要回滚时,InnoDB通常会选择该值较小(权重小)的进行回滚 |
| 7 | trx_mysql_thread_id |
事务关联的 MySQL 线程的标识符,用于将事务和执行该事务的 MySQL 线程关联起来。 |
| 8 | trx_query |
事务正在执行的 SQL 语句 |
| 9 | trx_operation_state |
事务的操作状态,提供关于事务操作的详细状态信息,如正在进行的操作阶段等。 |
| 10 | trx_tables_in_use |
事务正在使用的表的数量 |
| 11 | trx_tables_locked |
事务锁定的表的数量 |
| 12 | trx_lock_structs |
事务的锁结构的数量 |
| 13 | trx_lock_memory_bytes |
事务的锁占用的内存字节数 |
| 14 | trx_rows_locked |
事务锁定的行的数量 |
| 15 | trx_rows_modified |
事务修改的行的数量 |
| 16 | trx_concurrency_tickets |
事务并发的许可票数 |
| 17 | trx_isolation_level |
事务的隔离级别,如读未提交、读已提交、可重复读、可串行化。 |
| 18 | trx_unique_checks |
事务的唯一检查标志,表示是否进行唯一性检查,1 表示进行,0 表示不进行。 |
| 19 | trx_foreign_key_checks |
事务的外键检查标志,表示是否进行外键检查,1 表示进行,0 表示不进行。 |
| 20 | trx_last_foreign_key_error |
事务最近的外键错误信息,存储事务最后一次发生外键错误的错误信息。 |
| 21 | trx_adaptive_hash_latched |
事务的自适应哈希锁标志,可能与 InnoDB 的自适应哈希索引的锁机制有关。 |
| 22 | trx_adaptive_hash_timeout |
事务的自适应哈希超时时间,与自适应哈希索引的超时时间有关。 |
| 23 | trx_is_read_only |
事务是否为只读事务,1 表示是只读事务,0 表示不是。 |
| 24 | trx_autocommit_non_locking |
事务的自动提交非锁定标志 |
下面是我运行 事务A、B 得出的真实数据可供参考。
| 编号 | 字段名 | 事务A | 事务B |
|---|---|---|---|
| 1 | trx_id |
'139651' | '139650' |
| 2 | trx_state |
'RUNNING' | 'LOCK WAIT' |
| 3 | trx_started |
'2025-01-17 14:22:45' | '2025-01-17 14:22:44' |
| 4 | trx_requested_lock_id |
NULL | '139650:339:16:6' |
| 5 | trx_wait_started |
NULL | '2025-01-17 14:22:49' |
| 6 | trx_weight |
'2' | '3' |
| 7 | trx_mysql_thread_id |
'105' | '106' |
| 8 | trx_query |
'SELECT SLEEP(7)' | 'select * from wuzhen.t_news where id =5 for update' |
| 9 | trx_operation_state |
NULL | 'starting index read' |
| 10 | trx_tables_in_use |
'0' | '1' |
| 11 | trx_tables_locked |
'1' | '1' |
| 12 | trx_lock_structs |
'2' | '3' |
| 13 | trx_lock_memory_bytes |
'1136' | '1136' |
| 14 | trx_rows_locked |
'1' | '2' |
| 15 | trx_rows_modified |
'0' | '0' |
| 16 | trx_concurrency_tickets |
'0' | '0' |
| 17 | trx_isolation_level |
'REPEATABLE READ' | 'REPEATABLE READ' |
| 18 | trx_unique_checks |
'1' | '1' |
| 19 | trx_foreign_key_checks |
'1' | '1' |
| 20 | trx_last_foreign_key_error |
NULL | NULL |
| 21 | trx_adaptive_hash_latched |
'0' | '0' |
| 22 | trx_adaptive_hash_timeout |
'0' | '0' |
| 23 | trx_is_read_only |
'0' | '0' |
| 24 | trx_autocommit_non_locking |
'0' | '0' |
该表只是显示了当前事务情况,并不能直接判断锁的一些情况,如果需要查看所,则还需访问INNODB_LOCKS表。
3.2 INNODB_LOCKS 表
该表可以清晰地看到当前锁的详细信息。
| 编号 | 字段名 | 说明 |
|---|---|---|
| 1 | lock_id | 锁的 ID |
| 2 | lock_trx_id | 事务 ID |
| 3 | lock_mode | 锁的模式,排他锁、共享锁等 |
| 4 | lock_type | 锁的类型,表锁还是行锁 |
| 5 | lock_table | 要加锁的表 |
| 6 | lock_index | 锁住的索引 |
| 7 | lock_space | 锁对象的 space id |
| 8 | lock_page | 事务锁定页的数量。若是表锁,则该值为 NULL |
| 9 | lock_rec | 事务锁定行的数量,若是表锁,则该值为 NULL |
| 10 | lock_data | 事务锁定记录的主键值,若是表锁,则该值为 NULL |
详看真实表数据,就能解释 3.1中trx_state 一个是RUNNING,一个是LOCK WAIT了,他们在申请相同的资源,因此会阻塞。
| 编号 | 字段名 | 事务 A | 事务 B |
|---|---|---|---|
| 1 | lock_id | 139654:339:16:6 | 139653:339:16:6 |
| 2 | lock_trx_id | 139654 | 139653 |
| 3 | lock_mode | X | X |
| 4 | lock_type | RECORD | RECORD |
| 5 | lock_table | wuzhen.t_news |
wuzhen.t_news |
| 6 | lock_index | PRIMARY | PRIMARY |
| 7 | lock_space | 339 | 339 |
| 8 | lock_page | 16 | 16 |
| 9 | lock_rec | 6 | 6 |
| 10 | lock_data | 5 | 5 |
当事务较小时可以很直观的进行判断,但当事务量很大,其中锁和等待时常发生,就不那么容易判断了。这时我们可以通过 INNODB_LOCK_WAITS 很直观的反应当前事务的等待情况。
3.3 INNODB_LOCK_WAITS 表
表字段如下
| 编码 | 字段 | 说明 |
|---|---|---|
| 1 | requesting_trx_id | 申请锁资源的事务 ID |
| 2 | requesting_lock_id | 申请的锁的 ID |
| 3 | blocking_trx_id | 阻塞的事务 ID |
| 4 | blocking_lock_id | 阻塞的锁的 ID |
表数据示例
| 编码 | 字段 | 事务信息 |
|---|---|---|
| 1 | requesting_trx_id | 139660 |
| 2 | requested_lock_id | 139660:339:16:6 |
| 3 | blocking_trx_id | 139659 |
| 4 | blocking_lock_id | 139659:339:16:6 |
虽然可以直观的看到事务之间因锁竞争而阻塞的情况,但却只给出了 id 。
3张表可随意联合查询拿到你想要的,sql如下:
SELECT
    r.trx_id AS requesting_trx_id,
    r.trx_mysql_thread_id AS requesting_thread,
    r.trx_query AS requesting_query,
    b.trx_id AS blocking_trx_id,
    b.trx_mysql_thread_id AS blocking_thread,
    b.trx_query AS blocking_query
FROM INFORMATION_SCHEMA.INNODB_LOCK_WAITS w
JOIN INFORMATION_SCHEMA.INNODB_TRX r ON w.requesting_trx_id = r.trx_id
JOIN INFORMATION_SCHEMA.INNODB_TRX b ON w.blocking_trx_id = b.trx_id;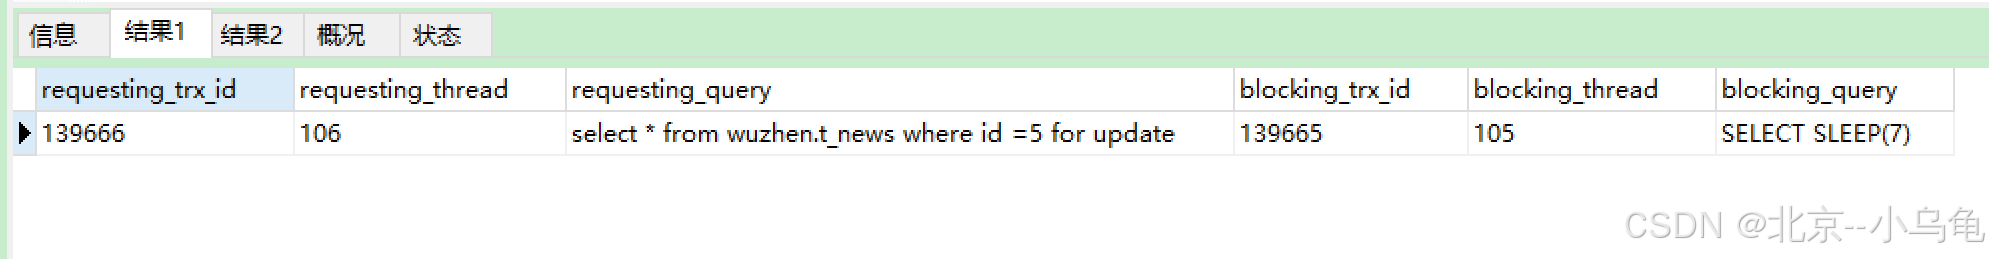
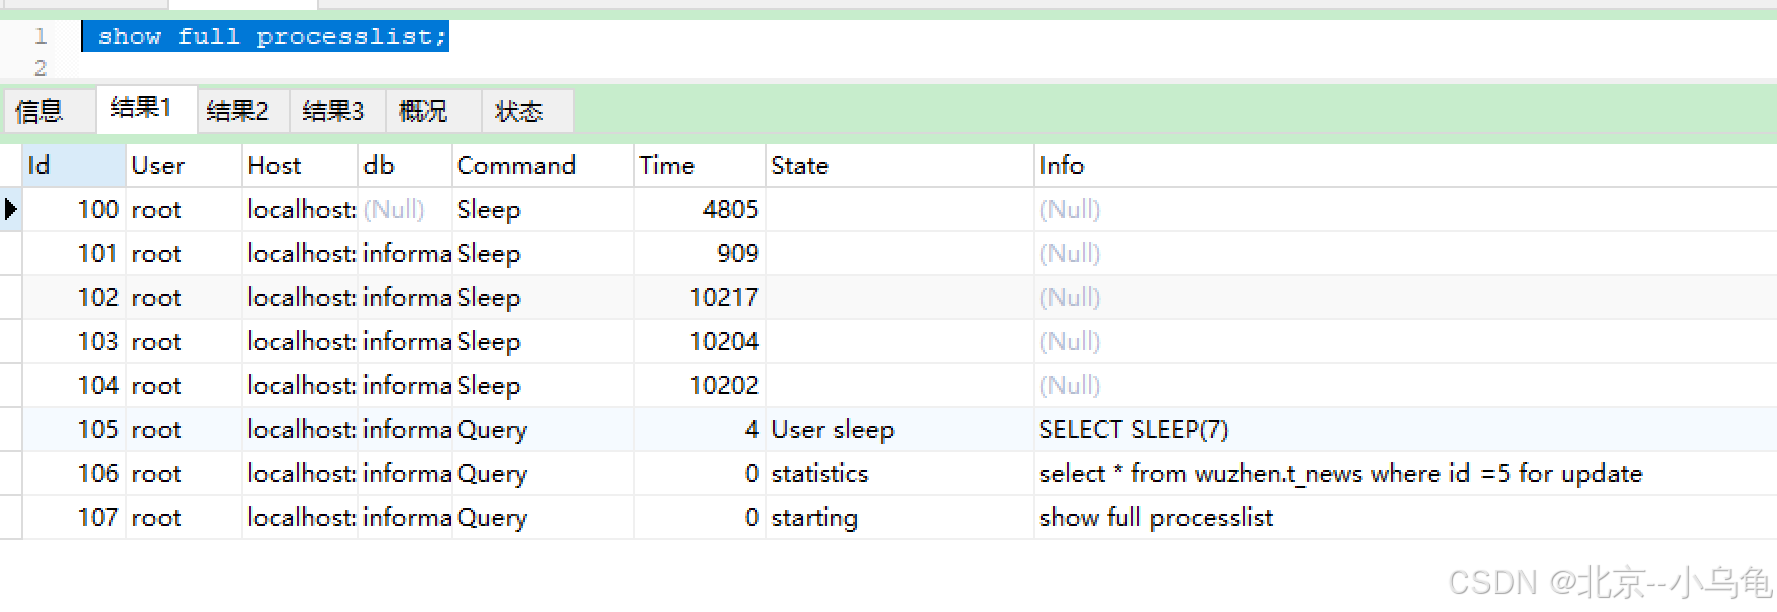
4. show full processlist 命令
显示当前正在运行的所有线程的信息,包括线程的 ID、用户、主机、数据库、命令、状态、时间等信息;
该命令只能说提供一些线索,个人以为在排查死锁或阻塞时作用有限。
5. 总结
到此详细讲解了两种分析死锁&阻塞的方式,命令行和巧用系统表;
其实有很多开源的诊断和优化工具,比如 Percona Toolkit 、MySQLTuner等,可以帮助我们更好的使用MySQL。
也可以基于 Prometheus + Grafana开发自己的监控&报警系统,问题越早发现越好。