一、效果概览
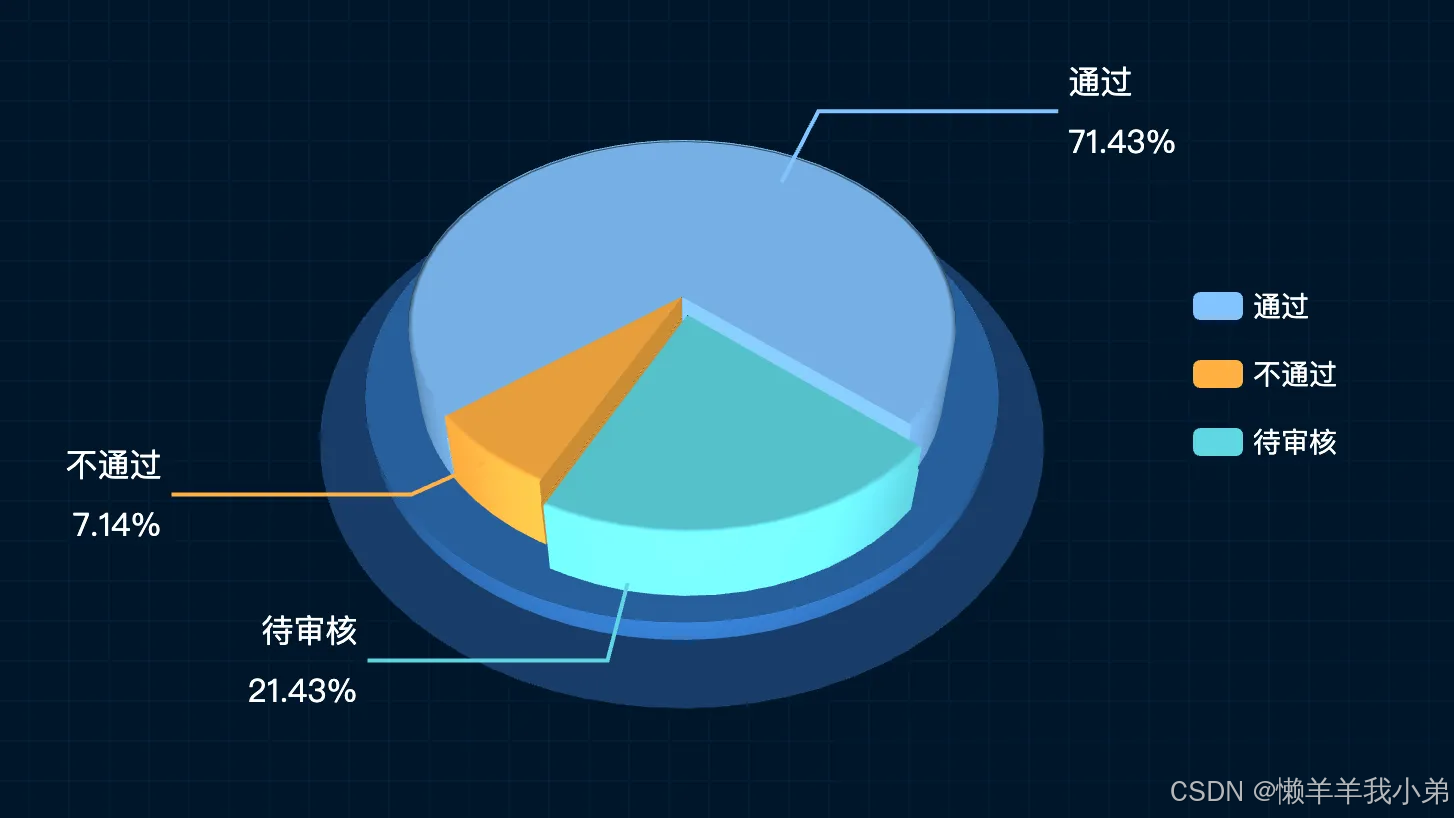
本文基于 Vue 3 和 ECharts GL,实现了一个具有以下特性的 3D 饼图:
- 立体视觉效果:通过参数方程构建 3D 扇形与底座
- 动态交互:支持点击选中(位移效果)和悬停高亮(放大效果)
- 混合渲染:结合 3D 曲面与 2D 饼图标签
- 风格化设计:暗色背景搭配网格纹理,增强科技感
二、核心技术实现
1. 环境准备
import { ref, onMounted } from "vue";
import * as echarts from "echarts";
import "echarts-gl"; // 引入 3D 扩展
2. 参数方程生成器
核心函数 getParametricEquation 通过数学公式动态构建 3D 曲面:
function getParametricEquation(startRatio, endRatio, isSelected, isHovered, k, h) {
  // 计算弧度范围
  const startRadian = startRatio * Math.PI * 2;
  const endRadian = endRatio * Math.PI * 2;

  // 动态参数控制
  const offsetX = isSelected ? Math.cos(midRadian) * 0.1 : 0;
  const hoverRate = isHovered ? 1.5 : 1;

  return {
    u: { min: -Math.PI, max: Math.PI * 3 },
    v: { min: 0, max: Math.PI * 2 },
    x: (u, v) => offsetX + Math.cos(u) * (1 + Math.cos(v)*k) * hoverRate,
    y: (u, v) => offsetY + Math.sin(u) * (1 + Math.cos(v)*k) * hoverRate,
    z: (u, v) => (Math.sin(v) > 0 ? h*0.1 : -1)
  };
}
- u/v:定义曲面参数范围
- hoverRate:悬停时放大系数(1.5倍)
- offsetX/Y:选中时的位移偏移
3. 复合图表配置
通过 getPie3D 生成多层结构:
function getPie3D(pieData, internalDiameterRatio) {
  const series = [];

  // 生成数据扇形
  pieData.forEach(item => {
    series.push({
      type: "surface",
      parametric: true,
      itemStyle: { color: item.itemStyle.color },
      parametricEquation: getParametricEquation(...)
    });
  });

  // 添加红色底座
  series.push({
    parametricEquation: {
      x: (u, v) => Math.sin(v)*0.6*Math.sin(u),
      z: () => Math.cos(v) > 0 ? 0.8 : -0.2
    },
    itemStyle: { color: "#2c68ac" }
  });

  // 透明支撑环(用于鼠标事件)
  series.push({
    itemStyle: { opacity: 0 },
    parametricEquation: {...}
  });

  return { series, grid3D: {...}, tooltip: {...} };
}
- 底座设计:通过两个红色圆柱增强立体层次感
- 透明环:解决 3D 曲面鼠标事件穿透问题
4. 交互事件处理
// 点击选中
myChart.on("click", (params) => {
  const target = option.series[params.seriesIndex];
  target.parametricEquation = getParametricEquation(..., true); // 触发位移
});

// 悬停高亮
myChart.on("mouseover", (params) => {
  option.series[params.seriesIndex].parametricEquation =
    getParametricEquation(..., hoverBarHeight); // 修改高度
});

// 全局恢复
myChart.on("globalout", () => {
  series.forEach(item => item.parametricEquation.z = defaultBarHeight);
});
三、样式优化技巧
1. 背景网格
.chart-container::before {
  background-image:
    linear-gradient(#0e2a47 1px, transparent 1px),
    linear-gradient(90deg, #0e2a47 1px, transparent 1px);
  background-size: 20px 20px;
}
2. 标签融合
{
  type: "pie",
  label: {
    formatter: "{b}\n{@percent}%",
    position: "outside",
    opacity: 0 // 通过 2D 饼图实现标签
  },
  itemStyle: { opacity: 0 } // 隐藏 2D 图形
}
四、最佳实践建议
性能优化:
- 调整
u/v.step值平衡渲染质量与性能 - 禁用非必要特效(如 postEffect)
- 调整
扩展方向:
- 增加
autoRotate实现自动旋转 - 结合
dataset实现动态数据更新
- 增加
调试技巧:
- 临时设置
wireframe: { show: true }观察曲面结构 - 使用
viewControl调整初始视角
- 临时设置
五、完整代码
<template>
  <div class="chart-container">
    <div ref="chartRef" class="chart"></div>
  </div>
</template>

<script setup>
import { ref, onMounted } from "vue";
import * as echarts from "echarts";
import "echarts-gl";

const chartRef = ref(null);
// 默认柱状图高度
const defaultBarHeight = 30;
// 鼠标滑过高度
const hoverBarHeight = 40;

onMounted(() => {
  const chartDom = chartRef.value;
  const myChart = echarts.init(chartDom);

  /**
   * 生成3D扇形的曲面参数方程
   * @param {number} startRatio - 起始比例 (0~1)
   * @param {number} endRatio - 结束比例 (0~1)
   * @param {boolean} isSelected - 是否选中状态
   * @param {boolean} isHovered - 是否悬停状态
   * @param {number} k - 辅助参数,控制扇形厚度
   * @param {number} h - 柱状图高度
   * @returns {Object} 曲面参数方程,包含u/v范围和x/y/z坐标函数
   */
  function getParametricEquation(
    startRatio,
    endRatio,
    isSelected,
    isHovered,
    k,
    h
  ) {
    // 计算中间比例和弧度值
    // 将比例(0~1)转换为弧度值(0~2π),用于三角函数计算
    let midRatio = (startRatio + endRatio) / 2;
    let startRadian = startRatio * Math.PI * 2; // 起始弧度
    let endRadian = endRatio * Math.PI * 2;    // 结束弧度
    let midRadian = midRatio * Math.PI * 2;    // 中间弧度

    // 如果只有一个扇形,则不实现选中效果。
    if (startRatio === 0 && endRatio === 1) {
      isSelected = false;
    }

    // 通过扇形内径/外径的值,换算出辅助参数 k(默认值 1/3)
    k = typeof k !== "undefined" ? k : 1 / 3;

    // 计算选中效果分别在 x/y 轴方向上的位移
    // 使用三角函数计算位移方向,0.1为位移幅度系数
    // 未选中状态位移为0,选中状态根据中间弧度计算位移方向
    let offsetX = isSelected ? Math.cos(midRadian) * 0.1 : 0;
    let offsetY = isSelected ? Math.sin(midRadian) * 0.1 : 0;

    // 计算高亮效果的放大比例
    // hoverRate=0.5表示悬停时放大50%,通过参数方程中的乘法实现
    let hoverRate = 0.5;

    // 返回曲面参数方程
    return {
      u: {
        min: -Math.PI,
        max: Math.PI * 3,
        step: Math.PI / 32,
      },

      v: {
        min: 0,
        max: Math.PI * 2,
        step: Math.PI / 20,
      },

      // x坐标函数:根据u/v参数计算曲面x坐标
      // 公式分解:
      // 1. Math.cos(u) - 基础圆形路径
      // 2. (1 + Math.cos(v) * k) - 控制扇形厚度
      // 3. hoverRate - 悬停放大系数
      // 4. offsetX - 选中位移
      x: function (u, v) {
        if (u < startRadian) {
          return (
            offsetX + Math.cos(startRadian) * (1 + Math.cos(v) * k) * hoverRate
          );
        }
        if (u > endRadian) {
          return (
            offsetX + Math.cos(endRadian) * (1 + Math.cos(v) * k) * hoverRate
          );
        }
        return offsetX + Math.cos(u) * (1 + Math.cos(v) * k) * hoverRate;
      },

      y: function (u, v) {
        if (u < startRadian) {
          return (
            offsetY + Math.sin(startRadian) * (1 + Math.cos(v) * k) * hoverRate
          );
        }
        if (u > endRadian) {
          return (
            offsetY + Math.sin(endRadian) * (1 + Math.cos(v) * k) * hoverRate
          );
        }
        return offsetY + Math.sin(u) * (1 + Math.cos(v) * k) * hoverRate;
      },

      z: function (u, v) {
        if (u < -Math.PI * 0.5) {
          return Math.sin(u);
        }
        if (u > Math.PI * 2.5) {
          return Math.sin(u) * h * 0.1;
        }
        return (Math.sin(v) > 0 ? 1 * h * 0.1 : -1) + 1;
      },
    };
  }

  /**
   * 生成3D饼图的完整配置项
   * @param {Array} pieData - 饼图数据数组
   * @param {number} internalDiameterRatio - 内径/外径比例
   * @returns {Object} ECharts配置项,包含series和legend等
   */
  function getPie3D(pieData, internalDiameterRatio) {
    let series = [];
    let sumValue = 0;
    let startValue = 0;
    let endValue = 0;
    let legendData = [];
    let k =
      typeof internalDiameterRatio !== "undefined"
        ? (1 - internalDiameterRatio) / (1 + internalDiameterRatio)
        : 1 / 3;

    // 为每一个饼图数据,生成一个 series-surface 配置
    for (let i = 0; i < pieData.length; i++) {
      sumValue += pieData[i].value;

      let seriesItem = {
        name:
          typeof pieData[i].name === "undefined"
            ? `series${i}`
            : pieData[i].name,
        type: "surface",
        parametric: true,
        wireframe: {
          show: false,
        },
        pieData: pieData[i],
        pieStatus: {
          selected: false,
          hovered: false,
          k: k,
        },
      };

      if (typeof pieData[i].itemStyle != "undefined") {
        let itemStyle = {};

        typeof pieData[i].itemStyle.color != "undefined"
          ? (itemStyle.color = pieData[i].itemStyle.color)
          : null;
        typeof pieData[i].itemStyle.opacity != "undefined"
          ? (itemStyle.opacity = pieData[i].itemStyle.opacity)
          : null;

        seriesItem.itemStyle = itemStyle;
      }
      series.push(seriesItem);
    }

    // 使用上一次遍历时,计算出的数据和 sumValue,调用 getParametricEquation 函数,
    // 向每个 series-surface 传入不同的参数方程 series-surface.parametricEquation,也就是实现每一个扇形。
    for (let i = 0; i < series.length; i++) {
      endValue = startValue + series[i].pieData.value;

      series[i].pieData.startRatio = startValue / sumValue;
      series[i].pieData.endRatio = endValue / sumValue;
      series[i].parametricEquation = getParametricEquation(
        series[i].pieData.startRatio,
        series[i].pieData.endRatio,
        false,
        false,
        k,
        defaultBarHeight
      );

      startValue = endValue;

      legendData.push(series[i].name);
    }

    // 添加两个红色圆柱底座
    series.push({
      name: "base1",
      type: "surface",
      parametric: true,
      silent: true,
      wireframe: {
        show: false,
      },
      itemStyle: {
        color: "#2c68ac",
        opacity: 1
      },
      parametricEquation: {
        u: {
          min: 0,
          max: Math.PI * 2,
          step: Math.PI / 40,
        },
        v: {
          min: 0,
          max: Math.PI,
          step: Math.PI / 40,
        },
        x: function (u, v) {
          return Math.sin(v) * 0.6 * Math.sin(u) + Math.sin(u) * 0.6;
        },
        y: function (u, v) {
          return Math.sin(v) * 0.6 * Math.cos(u) + Math.cos(u) * 0.6;
        },
        z: function (u, v) {
          return Math.cos(v) > 0 ? 0.8 : -0.2;
        },
      },
    });

    series.push({
      name: "base2",
      type: "surface",
      parametric: true,
      silent: true,
      wireframe: {
        show: false,
      },
      itemStyle: {
        color: "#1b4475",
        opacity: 1
      },
      parametricEquation: {
        u: {
          min: 0,
          max: Math.PI * 2,
          step: Math.PI / 40,
        },
        v: {
          min: 0,
          max: Math.PI,
          step: Math.PI / 40,
        },
        x: function (u, v) {
          return Math.sin(v) * 0.7 * Math.sin(u) + Math.sin(u) * 0.7;
        },
        y: function (u, v) {
          return Math.sin(v) * 0.7 * Math.cos(u) + Math.cos(u) * 0.7;
        },
        z: function (u, v) {
          return -1;
        },
      },
    });

    // 补充一个透明的圆环,用于支撑高亮功能的近似实现。
    series.push({
      name: "mouseoutSeries",
      type: "surface",
      parametric: true,
      wireframe: {
        show: false,
      },
      itemStyle: {
        opacity: 0,
      },
      parametricEquation: {
        u: {
          min: 0,
          max: Math.PI * 2,
          step: Math.PI / 20,
        },
        v: {
          min: 0,
          max: Math.PI,
          step: Math.PI / 20,
        },
        x: function (u, v) {
          return Math.sin(v) * Math.sin(u) + Math.sin(u);
        },
        y: function (u, v) {
          return Math.sin(v) * Math.cos(u) + Math.cos(u);
        },
        z: function (u, v) {
          return Math.cos(v) > 0 ? 0.1 : -0.1;
        },
      },
    });

    // 准备待返回的配置项,把准备好的 legendData、series 传入。
    let option = {
      //animation: false,
      legend: {
        data: legendData,
        orient: "vertical",
        right: "5%",
        top: "center",
        itemGap: 20,
        textStyle: {
          color: "#fff",
          fontSize: 14,
          // fontWeight: 'bold', // 增加字体加粗
        },
      },
      tooltip: {
        formatter: (params) => {
          if (params.seriesName !== "mouseoutSeries") {
            const value =
              option.series[params.seriesIndex]?.pieData?.value || "";
            return `${params.seriesName}<br/><span style="display:inline-block;margin-right:5px;border-radius:10px;width:10px;height:10px;background-color:${params.color};"></span>${value}`;
          }
        },
      },
      xAxis3D: {
        min: -1,
        max: 1,
      },
      yAxis3D: {
        min: -1,
        max: 1,
      },
      zAxis3D: {
        min: -1,
        max: 1,
      },
      grid3D: {
        show: false,
        boxHeight: 10,
        viewControl: {
          alpha: 45,
          distance: 250,
          rotateSensitivity: 0,
          zoomSensitivity: 0,
          panSensitivity: 0,
          autoRotate: false,
        },
      },
      series: series,
    };
    return option;
  }
  let data = [
    {
      value: 60,
      name: "通过",
      itemStyle: { color: "#82C3FF" },
    },
    {
      value: 6,
      name: "不通过",
      itemStyle: { color: "#FFB042" },
    },
    {
      value: 18,
      name: "待审核",
      itemStyle: { color: "#61D6E2" },
    },
  ];

  // 传入数据生成 option
  let option = getPie3D(data, 0);

  // 监听鼠标事件,实现饼图选中效果(单选),近似实现高亮(放大)效果。
  let selectedIndex = "";
  let hoveredIndex = "";

  // 监听点击事件,实现选中效果(单选)
  // 原理:通过修改参数方程中的offsetX/Y实现扇形位移效果
  myChart.on("click", function (params) {
    // 目标对象
    const target = option.series[params.seriesIndex] || {};
    // 从 option.series 中读取重新渲染扇形所需的参数,将是否选中取反。
    let isSelected = !target?.pieStatus?.selected;
    let isHovered = target?.pieStatus?.hovered;
    let k = target?.pieStatus?.k;
    let startRatio = target?.pieData?.startRatio;
    let endRatio = target?.pieData?.endRatio;
    const pieData = option.series[selectedIndex]?.pieData || {};
    // 如果之前选中过其他扇形,将其取消选中(对 option 更新)
    if (selectedIndex !== "" && selectedIndex !== params.seriesIndex) {
      option.series[selectedIndex].parametricEquation = getParametricEquation(
        pieData.startRatio,
        pieData.endRatio,
        false,
        false,
        k,
        defaultBarHeight
      );
      option.series[selectedIndex].pieStatus.selected = false;
    }

    // 对当前点击的扇形,执行选中/取消选中操作(对 option 更新)
    option.series[params.seriesIndex].parametricEquation =
      getParametricEquation(
        startRatio,
        endRatio,
        isSelected,
        isHovered,
        k,
        defaultBarHeight
      );
    option.series[params.seriesIndex].pieStatus.selected = isSelected;

    // 如果本次是选中操作,记录上次选中的扇形对应的系列号 seriesIndex
    isSelected ? (selectedIndex = params.seriesIndex) : null;

    // 使用更新后的 option,渲染图表
    myChart.setOption(option);
  });

  // 监听 mouseover,近似实现高亮(放大)效果
  // 原理:通过修改参数方程中的hoverRate实现放大效果
  myChart.on("mouseover", function (params) {
    // 准备重新渲染扇形所需的参数
    let isSelected;
    let startRatio;
    let endRatio;
    let k;
    let isHoveredNew = false;

    // 如果触发 mouseover 的扇形当前已高亮,则不做操作
    if (hoveredIndex === params.seriesIndex) {
      return;
      // 否则进行高亮及必要的取消高亮操作
    } else {
      // 如果当前有高亮的扇形,取消其高亮状态(对 option 更新)
      if (hoveredIndex !== "") {
        const hoverTarget = option.series[hoveredIndex] || {};
        // 从 option.series 中读取重新渲染扇形所需的参数,将是否高亮设置为 false。
        isSelected = hoverTarget?.pieStatus?.selected;
        isHoveredNew = false;
        startRatio = hoverTarget?.pieData?.startRatio;
        endRatio = hoverTarget?.pieData?.endRatio;
        k = hoverTarget?.pieStatus.k;

        // 对当前点击的扇形,执行取消高亮操作(对 option 更新)
        option.series[hoveredIndex].parametricEquation = getParametricEquation(
          startRatio,
          endRatio,
          isSelected,
          isHoveredNew,
          k,
          defaultBarHeight
        );
        option.series[hoveredIndex].pieStatus.hovered = isHoveredNew;

        // 将此前记录的上次选中的扇形对应的系列号 seriesIndex 清空
        hoveredIndex = "";
      }

      // 如果触发 mouseover 的扇形不是透明圆环,将其高亮(对 option 更新)
      if (params.seriesName !== "mouseoutSeries") {
        const seriesSeries = option.series[params.seriesIndex] || {};
        // 从 option.series 中读取重新渲染扇形所需的参数,将是否高亮设置为 true。
        isSelected = seriesSeries?.pieStatus?.selected;
        isHoveredNew = true;
        startRatio = seriesSeries?.pieData?.startRatio;
        endRatio = seriesSeries?.pieData?.endRatio;
        k = seriesSeries?.pieStatus?.k;

        // 对当前点击的扇形,执行高亮操作(对 option 更新)
        option.series[params.seriesIndex].parametricEquation =
          getParametricEquation(
            startRatio,
            endRatio,
            isSelected,
            isHoveredNew,
            k,
            hoverBarHeight
          );
        if (option.series[params.seriesIndex]?.pieStatus) {
          option.series[params.seriesIndex].pieStatus.hovered = isHoveredNew;
        } else {
          option.series[params.seriesIndex].pieStatus = {
            hovered: isHoveredNew,
          };
        }

        // 记录上次高亮的扇形对应的系列号 seriesIndex
        hoveredIndex = params.seriesIndex;
      }

      // 使用更新后的 option,渲染图表
      myChart.setOption(option);
    }
  });

  // 修正取消高亮失败的 bug
  myChart.on("globalout", function () {
    let isHoveredNew = false;
    let k;
    if (hoveredIndex !== "") {
      const curSeries = option.series[hoveredIndex] || {};
      // 从 option.series 中读取重新渲染扇形所需的参数,将是否高亮设置为 true。
      let isSelected = curSeries.pieStatus?.selected;
      k = curSeries?.pieStatus?.k;
      let startRatio = curSeries?.pieData?.startRatio;
      let endRatio = curSeries?.pieData?.endRatio;

      // 对当前点击的扇形,执行取消高亮操作(对 option 更新)
      option.series[hoveredIndex].parametricEquation = getParametricEquation(
        startRatio,
        endRatio,
        isSelected,
        isHoveredNew,
        k,
        defaultBarHeight
      );
      option.series[hoveredIndex].pieStatus.hovered = isHoveredNew;

      // 将此前记录的上次选中的扇形对应的系列号 seriesIndex 清空
      hoveredIndex = "";
    }

    // 使用更新后的 option,渲染图表
    myChart.setOption(option);
  });
  option.series.push({
    name: "pie2d",
    type: "pie",
    labelLine: {
      length: 40,
      length2: 120,
      lineStyle: {
        width: 2,
      },
    },
    label: {
      opacity: 1,
      show: true,
      position: "outside",
      fontSize: 16,
      itemStyle: {
        color: "#fff",
        fontSize: 14,
        fontWeight: "bold",
        fontFamily: "Arial, sans-serif",
      },
      textStyle: {
        color: "#fff",
        lineHeight: 30,
        rich: {
          top: {
            verticalAlign: "middle",
            padding: [0, 0, 0, 0],
          },
          bottom: {
            verticalAlign: "middle",
            padding: [0, 0, 0, 0],
          },
        },
      },
      formatter: (params) => {
        return `${params.name}\n${params.percent}%`;
      },
    },
    startAngle: -66, //起始角度,支持范围[0, 360]。
    clockwise: false, //饼图的扇区是否是顺时针排布。上述这两项配置主要是为了对齐3d的样式
    radius: ["40%", "36%"],
    // center: ['55%', '48%'], //指示线的位置
    data: data,
    itemStyle: {
      opacity: 0,
    },
  });
  myChart.setOption(option);

  // 组件卸载时清除事件监听
  return () => {
    window.removeEventListener("resize", resizeChart);
    myChart.dispose();
  };
});
</script>

<style scoped>
.chart-container {
  width: 100%;
  height: 100vh;
  background-color: #001529;
  display: flex;
  justify-content: center;
  align-items: center;
  position: relative;
}

.chart {
  width: 800px;
  height: 600px;
}

/* 添加网格背景 */
.chart-container::before {
  content: "";
  position: absolute;
  top: 0;
  left: 0;
  width: 100%;
  height: 100%;
  background-image: linear-gradient(#0e2a47 1px, transparent 1px),
    linear-gradient(90deg, #0e2a47 1px, transparent 1px);
  background-size: 20px 20px;
  opacity: 0.3;
  z-index: 0;
}

.chart {
  z-index: 1;
}
</style>
通过本文方案,开发者可快速构建具有强交互性的 3D 数据可视化组件。关键点在于参数方程的灵活运用与事件系统的深度集成,这种模式可扩展至其他 3D 图表类型(如柱状图、散点图)的开发。