前言
该组件基于 Vue.js 和 AntV G6 构建
项目特色功能
1. 丰富的节点图标支持
本拓扑图系统的最大特色是支持使用自定义图片作为节点图标
2. 智能的力导向布局
系统采用力导向布局算法,能够自动优化节点位置,避免重叠,形成美观的网络拓扑结构。用户无需手动调整节点位置,系统会自动计算出最佳的显示效果。
3. 丰富的交互功能
- 拖拽操作:支持节点拖拽,用户可以手动调整布局
- 缩放平移:支持画布缩放和平移,方便查看大型网络
- 悬停效果:鼠标悬停显示详细信息
- 点击复制:点击节点可将信息复制到剪贴板
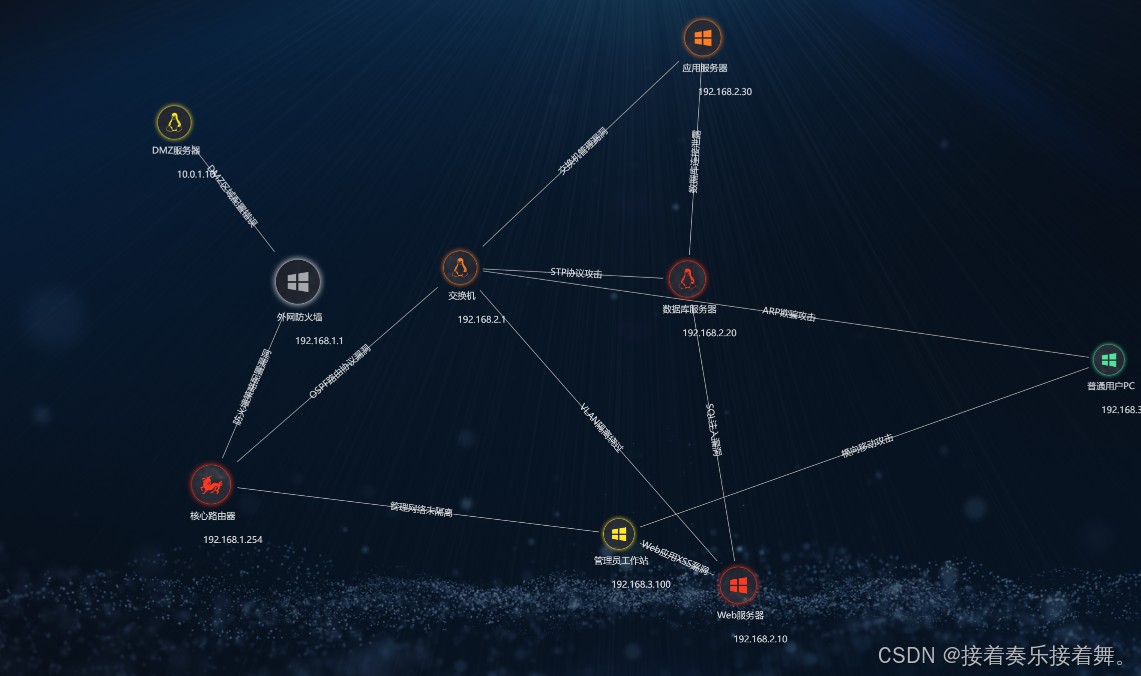
4. 漏洞信息展示
边缘连接不仅表示网络连接关系,还能显示具体的漏洞信息,如:
- SQL注入漏洞
- XSS跨站脚本攻击
- 网络协议漏洞
- 配置错误等
第一步:安装依赖
首先确保项目中已安装必要的依赖包:
npm install @antv/g6 vue axios
第二步:准备图标资源
在项目的 `public/目录下放置设备图标文件:
public/

    defalut.png          # 默认设备图标
    kylin_high.png       # 麒麟系统高危
    linux_mid.png        # Linux中危
    win_high.png         # Windows高危
    win_low.png          # Windows低危
    win_safety.png       # Windows安全
    linux_high.png       # Linux高危
    linux_low.png        # Linux低危
第三步:创建拓扑图组件
创建主要的拓扑图组件文件:
<template>
  <div class="topology-container">
    <div id="container" class="topology-canvas"></div>
    <screen-component
      :objF="objF"
      :currentEve="currentEve"
      :questionList="questionList"
      :list="list"
      @realType="handleRealType"
    />
  </div>
</template>

<script>
import { Graph, NodeEvent } from '@antv/g6'
import axios from 'axios'
import ScreenComponent from './screen.vue'

export default {
  name: 'TopologyViewer',
  components: {
    ScreenComponent
  },
  data() {
    return {
      graphHH: null,
      objF: {},
      currentEve: [],
      questionList: [],
      list: []
    }
  }
}
</script>
第四步:实现数据获取逻辑
methods: {
  async fetchTopologyData(type) {
    try {
      const urlParams = new URLSearchParams(window.location.search);
      const taskId = urlParams.get('taskId');

      const response = await axios.get(
        `/api/topology?taskId=${taskId}&type=${type}`,
        {
          headers: {
            'platform-token': 'your-token-here'
          }
        }
      );

      if (response.data.code === 200) {
        const topologyData = response.data.data;
        this.processTopologyData(topologyData);
      }
    } catch (error) {
      console.error('获取拓扑数据失败:', error);
      this.useDefaultData();
    }
  }
}
第五步:初始化拓扑图
initTopology(allData) {
  // 销毁现有实例
  if (this.graphHH) {
    this.graphHH.destroy();
    this.graphHH = null;
  }

  const graph = new Graph({
    container: document.getElementById("container"),
    width: 1520,
    height: 900,
    data: {
      nodes: allData.nodes.map((node) => ({
        id: node.id,
        type: node.type || "circle",
        style: {
          size: node.size || 60,
          labelText: `${node.name}\n${node.title}`,
          labelFill: '#fff',
          src: node.style?.src,
          fill: "rgba(255,255,255,.9)"
        }
      })),
      edges: allData.edges.map((edge) => ({
        id: edge.id,
        source: edge.source,
        target: edge.target,
        style: {
          labelText: edge.vulName,
          stroke: "#aaa",
          lineWidth: 1,
          labelFill: "rgba(255,255,255,.8)"
        }
      }))
    },
    layout: {
      type: "force"
    },
    behaviors: [
      'hover-activate',
      'drag-canvas',
      'zoom-canvas',
      'drag-node',
      'drag-element'
    ]
  });

  // 绑定事件
  this.bindEvents(graph);

  this.graphHH = graph;
  graph.render();
}
数据结构说明
节点数据结构
{
  id: 'firewall-001',           // 唯一标识
  name: '外网防火墙',            // 显示名称
  type: 'image',                // 节点类型
  size: 80,                     // 节点大小
  title: '192.168.1.1',         // 副标题(如IP地址)
  style: {
    src: '/img2/firewall.png'   // 图标路径
  }
}
边缘数据结构
{
  id: 'edge-001',               // 唯一标识
  source: 'firewall-001',       // 源节点ID
  target: 'router-001',         // 目标节点ID
  vulName: '防火墙策略配置漏洞'   // 漏洞描述
}
高级功能实现
1. 节点状态管理
实现不同状态下节点的视觉效果:
// 设置节点状态
setNodeState(nodeId, state) {
  const graph = this.graphHH;

  switch(state) {
    case 'active':
      graph.updateNodeData([{
        id: nodeId,
        style: {
          stroke: '#ff4d4f',
          shadowBlur: 10,
          shadowColor: 'rgba(255, 77, 79, 0.5)'
        }
      }]);
      break;
    case 'normal':
      graph.updateNodeData([{
        id: nodeId,
        style: {
          stroke: '#d9d9d9',
          shadowBlur: 0
        }
      }]);
      break;
  }

  graph.draw();
}
2. 动态数据更新
支持实时更新拓扑数据:
updateTopologyData(newData) {
  const graph = this.graphHH;

  // 更新节点
  if (newData.nodes) {
    graph.updateData({
      nodes: newData.nodes.map(node => ({
        id: node.id,
        style: node.style
      }))
    });
  }

  // 更新边缘
  if (newData.edges) {
    graph.updateData({
      edges: newData.edges.map(edge => ({
        id: edge.id,
        style: edge.style
      }))
    });
  }
}
3. 搜索和筛选功能
实现节点搜索和类型筛选:
searchNodes(keyword) {
  const graph = this.graphHH;
  const allNodes = graph.getNodes();

  allNodes.forEach(node => {
    const nodeData = graph.getNodeData(node.id);
    const isMatch = nodeData.name.includes(keyword) ||
                   nodeData.title.includes(keyword);

    graph.updateNodeData([{
      id: node.id,
      style: {
        opacity: isMatch ? 1 : 0.3
      }
    }]);
  });

  graph.draw();
}

filterByType(deviceType) {
  const graph = this.graphHH;
  const allNodes = graph.getNodes();

  allNodes.forEach(node => {
    const nodeData = graph.getNodeData(node.id);
    const isVisible = deviceType === 'all' ||
                     nodeData.deviceType === deviceType;

    graph.updateNodeData([{
      id: node.id,
      style: {
        display: isVisible ? 'block' : 'none'
      }
    }]);
  });

  graph.draw();
}
性能优化建议
1. 大数据量处理
当节点数量超过1000个时,建议采用以下优化策略:
// 启用性能模式
const graph = new Graph({
  // ... 其他配置
  modes: {
    default: ['drag-canvas', 'zoom-canvas']
  },
  // 禁用一些耗性能的功能
  animate: false,
  groupByTypes: false
});
2. 内存管理
正确的实例销毁:
beforeDestroy() {
  if (this.graphHH) {
    this.graphHH.destroy();
    this.graphHH = null;
  }

  // 清理定时器
  if (this.intervalId) {
    clearInterval(this.intervalId);
  }
}
3. 事件优化
避免频繁的事件触发:
// 使用防抖处理鼠标事件
const debouncedHover = debounce((e) => {
  // 悬停处理逻辑
}, 100);

graph.on(NodeEvent.POINTER_ENTER, debouncedHover);
样式定制
CSS样式配置
.topology-container {
  width: 100%;
  height: 100vh;
  background: linear-gradient(135deg, #667eea 0%, #764ba2 100%);
  position: relative;
}

.topology-canvas {
  width: 100%;
  height: 100%;
  border-radius: 10px;
  box-shadow: 0 10px 30px rgba(0, 0, 0, 0.2);
}

/* 节点标签样式 */
.g6-tooltip {
  background: rgba(0, 0, 0, 0.8);
  color: white;
  border-radius: 4px;
  padding: 8px 12px;
  font-size: 12px;
}
常见问题及解决方案
- 图标不显示:检查图片路径是否正确,确保图片文件存在
- 节点重叠:调整力导向布局参数或增加画布大小
- 性能问题:减少节点数量或禁用动画效果
- 事件不响应:检查事件绑定是否正确,确保DOM元素已渲染