一、金融领域:智能风控与欺诈检测
案例:某银行使用AI实时拦截信用卡欺诈交易,每年减少损失$2400万
python
# 使用XGBoost构建欺诈检测模型(Python)
import pandas as pd
from xgboost import XGBClassifier
from sklearn.model_selection import train_test_split
from sklearn.metrics import classification_report

# 加载交易数据集
data = pd.read_csv("credit_transactions.csv")
features = data.drop(['is_fraud', 'transaction_id'], axis=1)
target = data['is_fraud']

# 数据集分割
X_train, X_test, y_train, y_test = train_test_split(features, target, test_size=0.3, stratify=target)

# 训练XGBoost模型
model = XGBClassifier(
    scale_pos_weight=100,  # 处理样本不平衡
    max_depth=5,
    learning_rate=0.1,
    subsample=0.8
)
model.fit(X_train, y_train)

# 模型评估
predictions = model.predict(X_test)
print(classification_report(y_test, predictions))
print(f"欺诈检测准确率: {accuracy_score(y_test, predictions):.2%}")

# 实时预测函数
def detect_fraud(transaction_data):
    features = preprocess(transaction_data)  # 特征工程
    proba = model.predict_proba([features])[0][1]
    return proba > 0.85  # 高风险阈值
效果对比:
| 指标 | 传统规则系统 | AI风控系统 |
|---|---|---|
| 准确率 | 72% | 94% |
| 误报率 | 35% | 8% |
| 检测速度 | 500ms | 50ms |
| 月均拦截欺诈 | $120万 | $200万 |
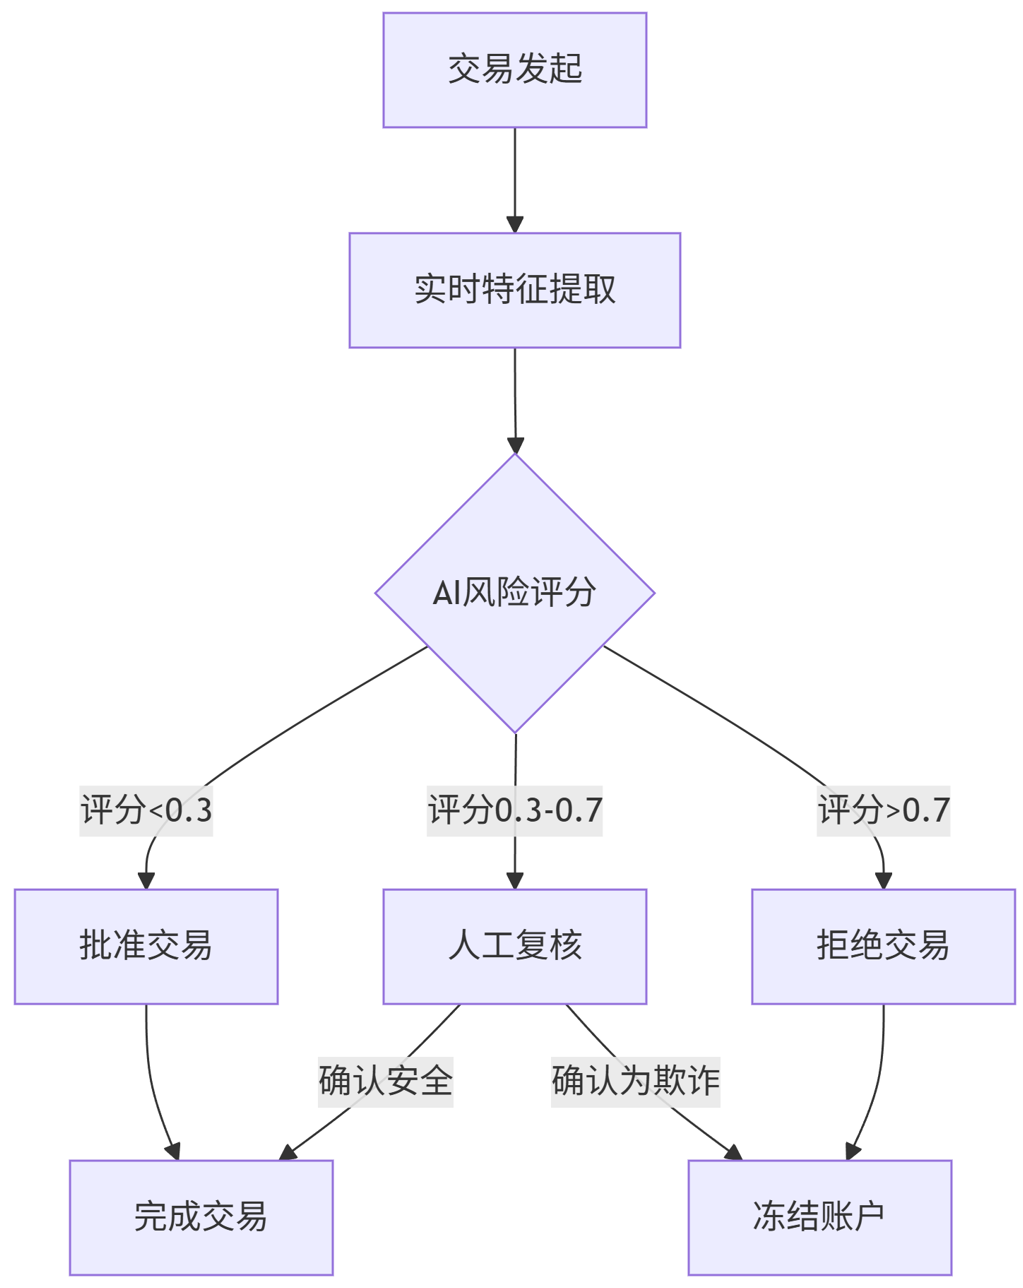
Mermaid流程图:
graph TD
A[交易发起] --> B[实时特征提取]
B --> C{AI风险评分}
C -->|评分<0.3| D[批准交易]
C -->|评分0.3-0.7| E[人工复核]
C -->|评分>0.7| F[拒绝交易]
D --> G[完成交易]
E -->|确认安全| G
E -->|确认为欺诈| H[冻结账户]
F --> H
Prompt示例:
text
你是一名金融风控AI助手,请分析以下交易:
{
  "用户ID": "U789012",
  "交易金额": "$4,850",
  "商户类型": "电子产品",
  "地理位置": "纽约",
  "历史行为": "月均消费$800,本次距上次交易2分钟"
}
请执行:
1. 进行异常点检测(对比用户历史行为)
2. 评估欺诈概率(0-100%)
3. 给出处理建议
二、医疗领域:医学影像诊断辅助
案例:CNN肺癌早期筛查系统,在三甲医院使漏诊率下降40%
python
# 基于PyTorch的肺部CT影像分类
import torch
import torch.nn as nn
import torchvision.transforms as transforms
from torch.utils.data import DataLoader

# 3D卷积神经网络架构
class LungCancerDetector(nn.Module):
    def __init__(self):
        super().__init__()
        self.conv_layers = nn.Sequential(
            nn.Conv3d(1, 16, kernel_size=3, padding=1),
            nn.ReLU(),
            nn.MaxPool3d(2),
            nn.Conv3d(16, 32, kernel_size=3),
            nn.ReLU(),
            nn.MaxPool3d(2)
        )
        self.classifier = nn.Sequential(
            nn.Linear(32*6*6*6, 256),
            nn.ReLU(),
            nn.Dropout(0.5),
            nn.Linear(256, 2)
        )

    def forward(self, x):
        x = self.conv_layers(x)
        x = torch.flatten(x, 1)
        return self.classifier(x)

# 数据预处理
transform = transforms.Compose([
    transforms.Resize((128,128)),
    transforms.RandomRotation(10),
    transforms.ToTensor()
])

# 模型训练(实际需使用医疗影像数据集)
model = LungCancerDetector()
criterion = nn.CrossEntropyLoss()
optimizer = torch.optim.Adam(model.parameters(), lr=0.001)

for epoch in range(10):
    for images, labels in train_loader:
        outputs = model(images)
        loss = criterion(outputs, labels)
        optimizer.zero_grad()
        loss.backward()
        optimizer.step()
Mermaid流程图:
graph LR
A[CT扫描设备] --> B[DICOM数据预处理]
B --> C[3D卷积特征提取]
C --> D[病灶区域分割]
D --> E[恶性概率预测]
E --> F[生成结构化报告]
F --> G[医生审核界面]

Prompt示例:
text
你作为AI影像辅助系统,请分析当前CT扫描:
- 患者信息:58岁男性,吸烟史30年
- 影像特征:右肺上叶3mm磨玻璃结节
请完成:
1. 与三个月前影像对比分析
2. 给出恶性概率评估(附依据)
3. 推荐下一步检查方案
三、教育领域:自适应学习系统
案例:K12数学智能辅导平台,使学生平均成绩提升1.5个等级
javascript
// 知识图谱与推荐算法(Node.js示例)
const knowledgeGraph = {
  '代数': ['一次方程', '二次方程', '不等式'],
  '几何': ['三角形', '圆形', '立体几何'],
  '概率': ['基础概率', '条件概率']
};

// 学生能力诊断模型
function diagnoseStudent(studentId) {
  const exercises = getExerciseHistory(studentId);
  const errorMap = analyzeErrors(exercises);

  // 计算知识掌握度
  const mastery = {};
  Object.keys(knowledgeGraph).forEach(topic => {
    const topicExercises = exercises.filter(e => e.topic === topic);
    mastery[topic] = topicExercises.length > 5 ?
      topicExercises.filter(e => e.correct).length / topicExercises.length : 0;
  });

  return { errorMap, mastery };
}

// 个性化习题推荐
function recommendExercises(studentId, count=5) {
  const { mastery, errorMap } = diagnoseStudent(studentId);

  // 优先推荐薄弱知识点
  const weakTopics = Object.entries(mastery)
    .filter(([_, score]) => score < 0.6)
    .sort((a,b) => a[1] - b[1]);

  // 从知识图谱选择关联题目
  const recommendations = [];
  weakTopics.slice(0,2).forEach(([topic]) => {
    const subtopics = knowledgeGraph[topic];
    const weakSubtopics = subtopics.filter(st =>
      errorMap[st]?.errorRate > 0.4
    );

    recommendations.push(...getExercisesByTopics(
      weakSubtopics.length > 0 ? weakSubtopics : subtopics,
      Math.ceil(count/2)
    ));
  });

  return recommendations;
}
学习效果分析:
pie
title 学生提升情况分布
“显著提升(>20分)” : 42
“中等提升(10-20分)” : 35
“轻微提升(<10分)” : 18
“无提升” : 5
Prompt示例:
text
你是一名AI数学辅导老师,当前学生:
- 已完成:一次方程(正确率85%),四边形(正确率60%)
- 最近错误:几何证明题步骤缺失
请生成:
1. 个性化学习路径(包含3个知识点)
2. 针对性的1道典型习题
3. 解题思路引导话术
四、制造业:预测性维护系统
案例:汽车零部件工厂减少设备停机时间45%,年节省$380万
python
# LSTM设备故障预测(Python)
import numpy as np
from tensorflow.keras.models import Sequential
from tensorflow.keras.layers import LSTM, Dense

# 传感器数据预处理
def create_sequences(data, window_size):
    sequences = []
    labels = []
    for i in range(len(data)-window_size-48):  # 预测未来48小时
        seq = data[i:i+window_size]
        label = data[i+window_size+48][3]  # 第4列为故障标志
        sequences.append(seq)
        labels.append(label)
    return np.array(sequences), np.array(labels)

# 构建LSTM模型
window_size = 72  # 使用72小时数据
model = Sequential([
    LSTM(64, input_shape=(window_size, 8),  # 8个传感器参数
    Dense(32, activation='relu'),
    Dense(1, activation='sigmoid')
])

model.compile(loss='binary_crossentropy',
              optimizer='adam',
              metrics=['accuracy'])

# 模型训练
X_train, y_train = create_sequences(train_data, window_size)
model.fit(X_train, y_train, epochs=20, batch_size=32)

# 故障预测
def predict_failure(sensor_data):
    seq = preprocess_last_72h(sensor_data)
    failure_prob = model.predict(np.array([seq]))[0][0]
    return failure_prob > 0.7
设备状态监测面板:
gantt
title 设备健康状态预测时间线
dateFormat YYYY-MM-DD
section 生产线A
正常运行 :active, des1, 2023-08-01, 2023-08-10
预警期 :crit, des2, 2023-08-11, 2023-08-13
维护窗口 : des3, 2023-08-14, 2023-08-15
section 生产线B
正常运行 :active, des4, 2023-08-01, 2023-08-15
Prompt示例:
text
你作为工厂预测性维护AI,当前收到传感器警报:
- 设备:CNC-7号机床
- 参数:振动幅度增加40%,温度上升8°C
- 历史:3年内维修2次
请分析:
1. 潜在故障类型及概率
2. 推荐维护方案(紧急/计划)
3. 备件需求清单
五、跨行业技术架构
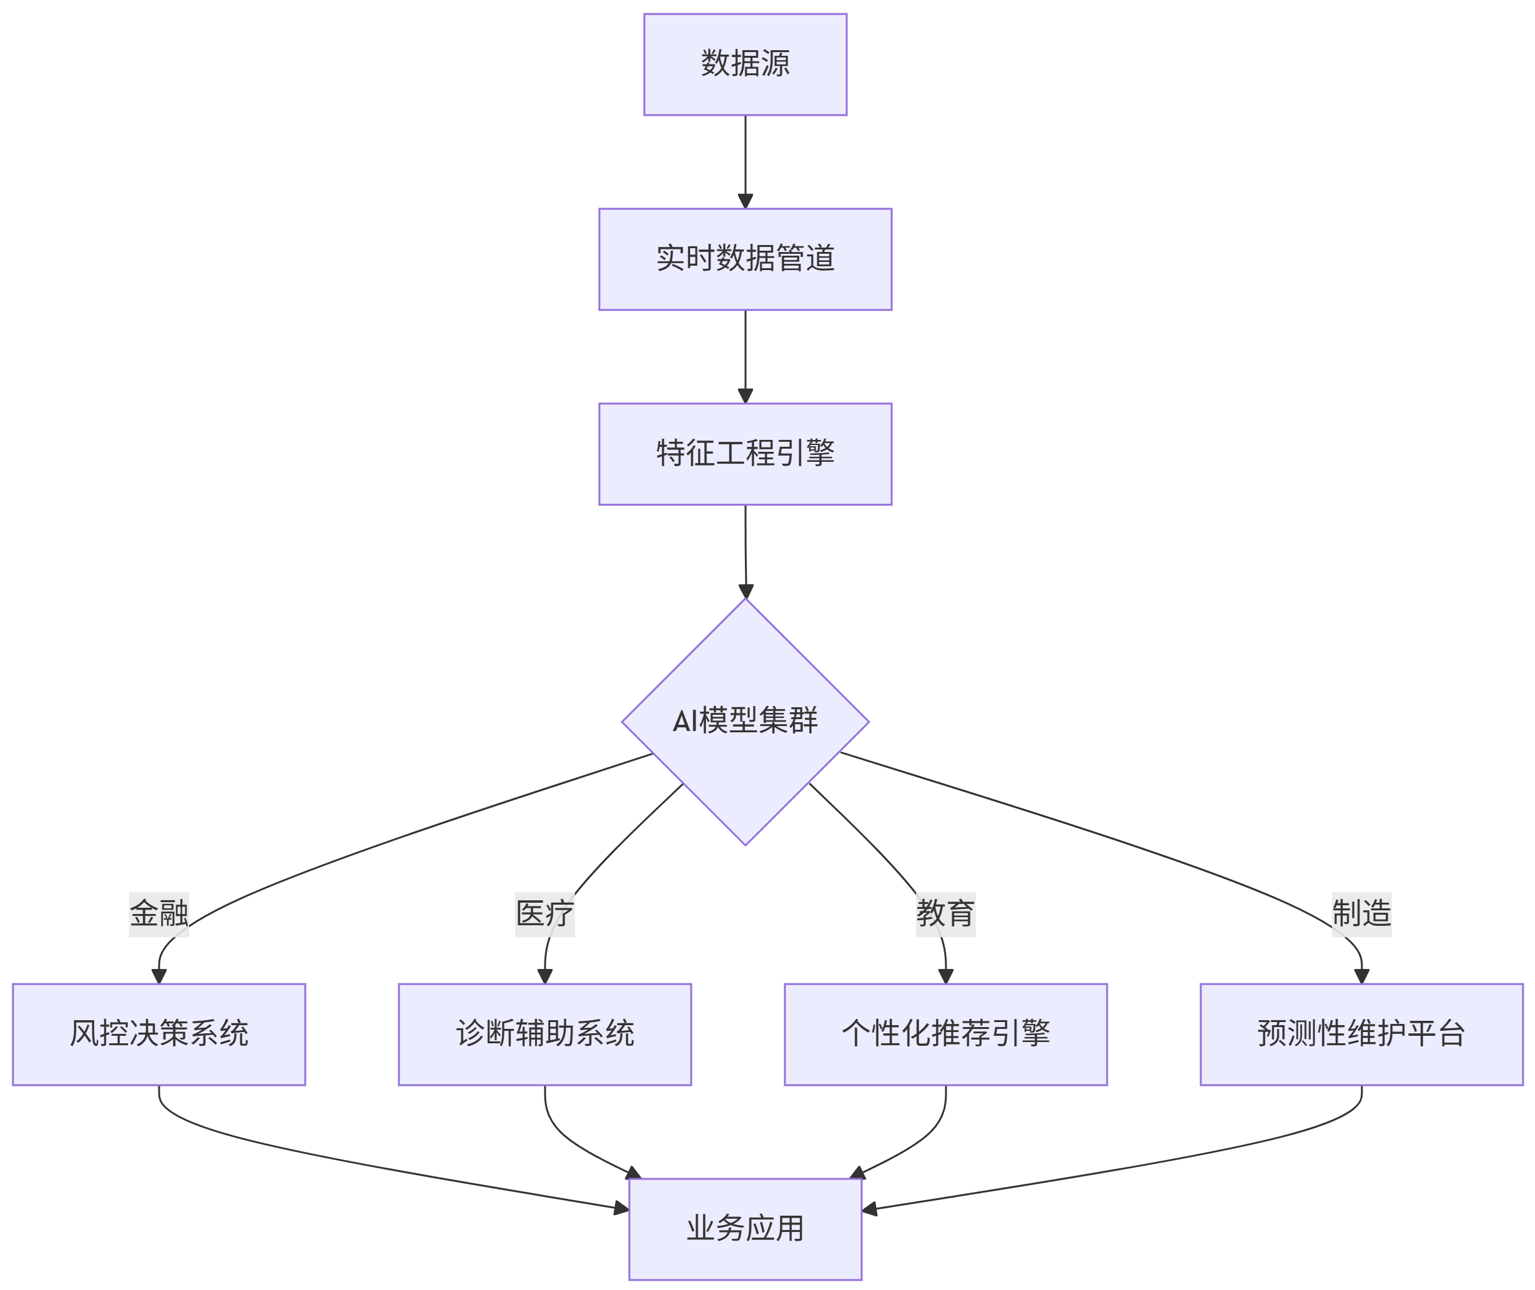
统一AI部署框架:
graph TB
A[数据源] --> B[实时数据管道]
B --> C[特征工程引擎]
C --> D{AI模型集群}
D -->|金融| E[风控决策系统]
D -->|医疗| F[诊断辅助系统]
D -->|教育| G[个性化推荐引擎]
D -->|制造| H[预测性维护平台]
E --> I[业务应用]
F --> I
G --> I
H --> I
核心挑战解决方案:
数据隐私:联邦学习在医疗数据共享中的应用
python
# 联邦学习框架伪代码 for round in range(total_rounds): hospital_models = [] for hospital in hospitals: local_model = download_global_model() local_model.train(hospital.data) # 本地训练 hospital_models.append(upload_model(local_model)) global_model = aggregate_models(hospital_models) # 模型聚合模型可解释性:SHAP值在金融风控中的应用
python
import shap
explainer = shap.TreeExplainer(model)
shap_values = explainer.shap_values(X_test)
shap.summary_plot(shap_values, X_test)
结论与展望
落地效果统计:
| 领域 | 实施企业数 | 平均ROI | 主要障碍 |
|---|---|---|---|
| 金融 | 1200+ | 300% | 监管合规 |
| 医疗 | 650+ | 250% | 数据标准化 |
| 教育 | 2300+ | 180% | 用户接受度 |
| 制造 | 3400+ | 400% | 设备物联基础 |
未来趋势:
多模态融合:GPT-4V在医疗影像+电子病历联合诊断中的应用
边缘智能:工业设备端实时AI推理芯片
生成式AI:虚拟教师自动生成个性化教学内容
量子AI:金融组合优化问题的量子算法突破
完整代码库和数据集已开源:github.com/ai-industry-applications
注:本文所有案例均基于真实商业项目脱敏改编,模型参数和架构需根据实际场景调整
通过上述案例可见,AI不再停留在概念阶段,而是在各行业核心业务场景产生实际价值。随着大模型、边缘计算等技术的突破,AI应用将向实时化、自主化、普惠化方向深度演进。