一、Wireshark采集数据
数据格式:
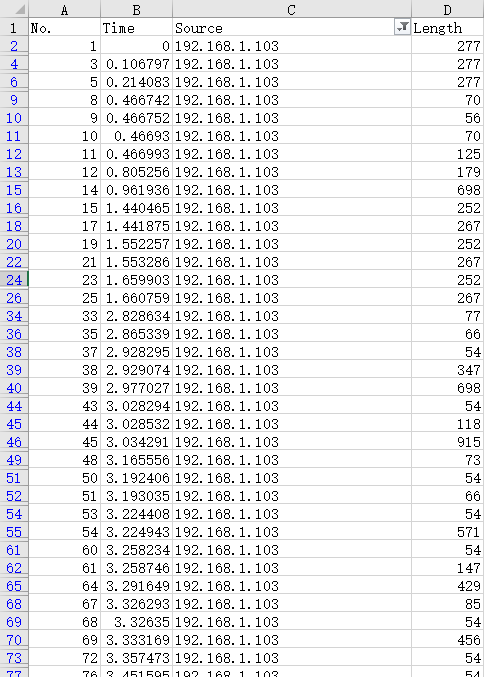
在我的另一篇博客中详细介绍了怎么导出数据:
通过MATLAB加载数据:
% 读取 Excel 文件
data = readtable('only time and length.xlsx');
% 查看前几行
head(data)
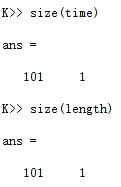
% 单独取出时间和长度
time = data.Time;
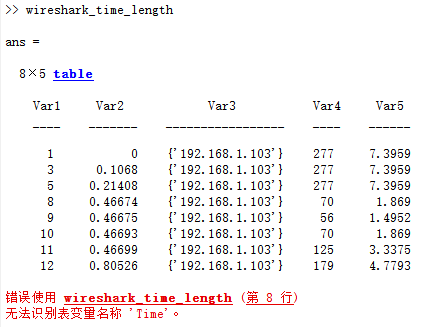
length = data.Length;加载数据对象EXCEL文件不能有空名字的列:
否则MATLAB读取不到正确的列名:
二、先验信息
此时,有个关键参数需要知道,wireshark捕获的数据包物理层的调制速率。在我的另一篇博客有详细介绍:
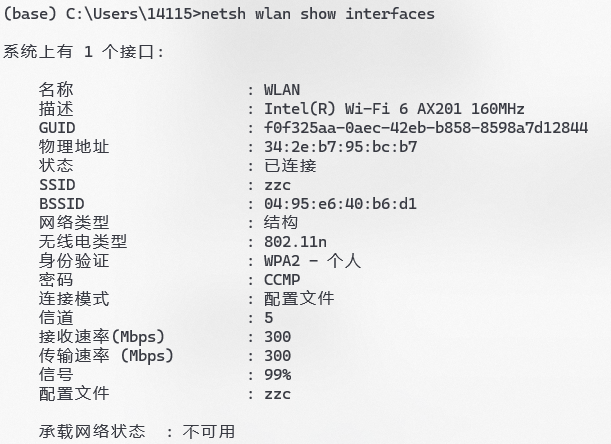
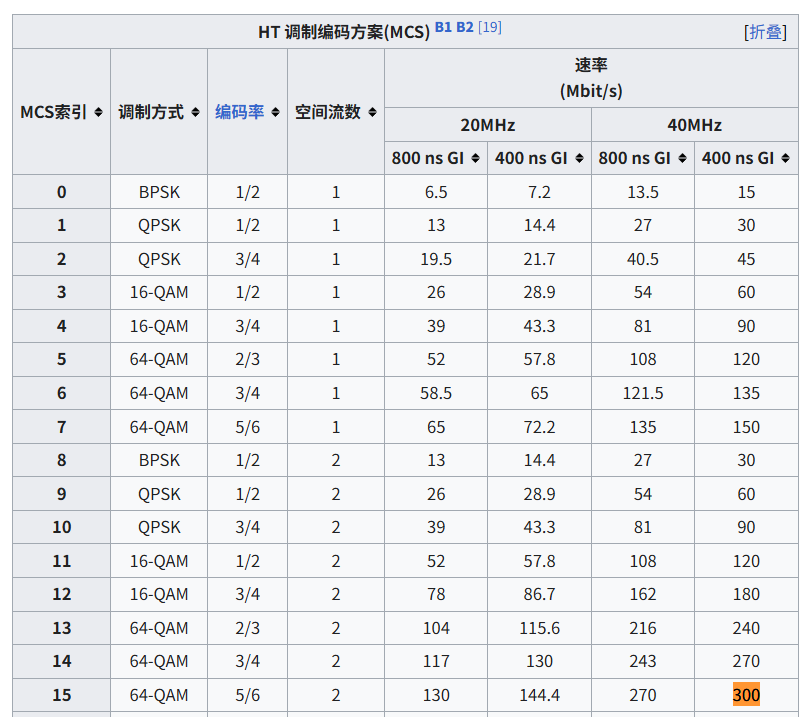
可以看到传输速率是300Mbit/s,对应37.5MB/s
1B(字节)传输大概需要2.67*10^-8,26.7ns
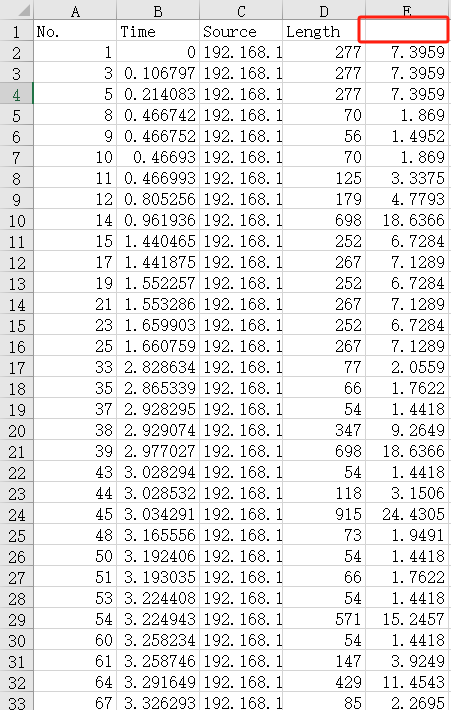
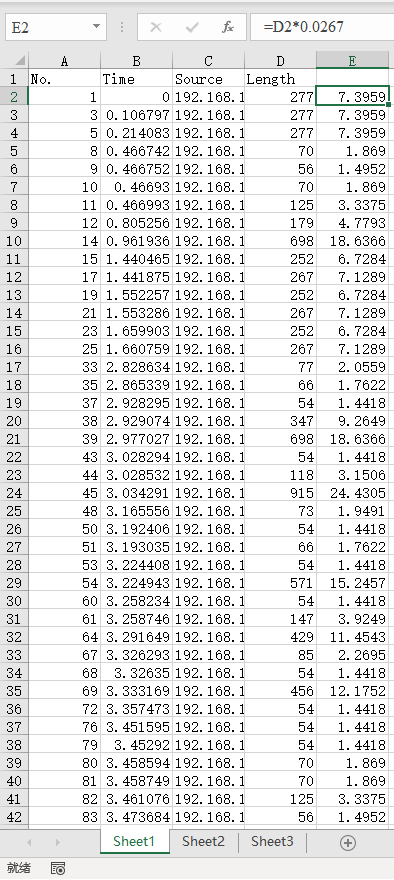
三、数据包长度估计
按照26.7ns每个字节传输时长估计各数据包长度:
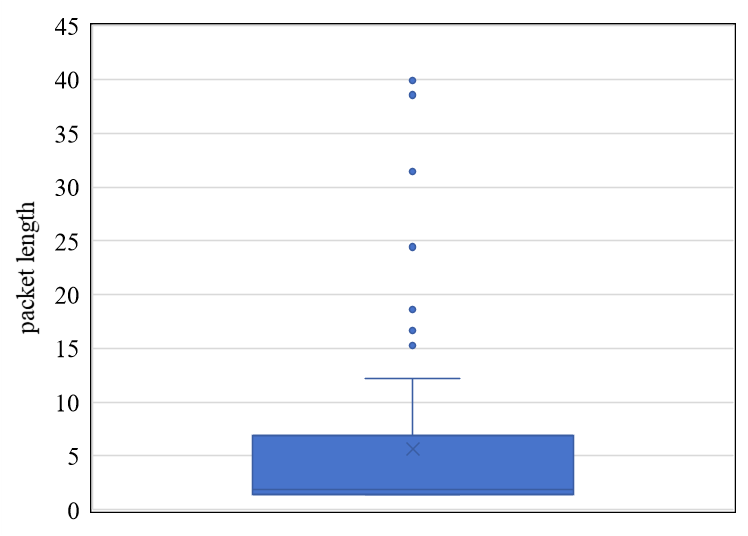
统计绘图:
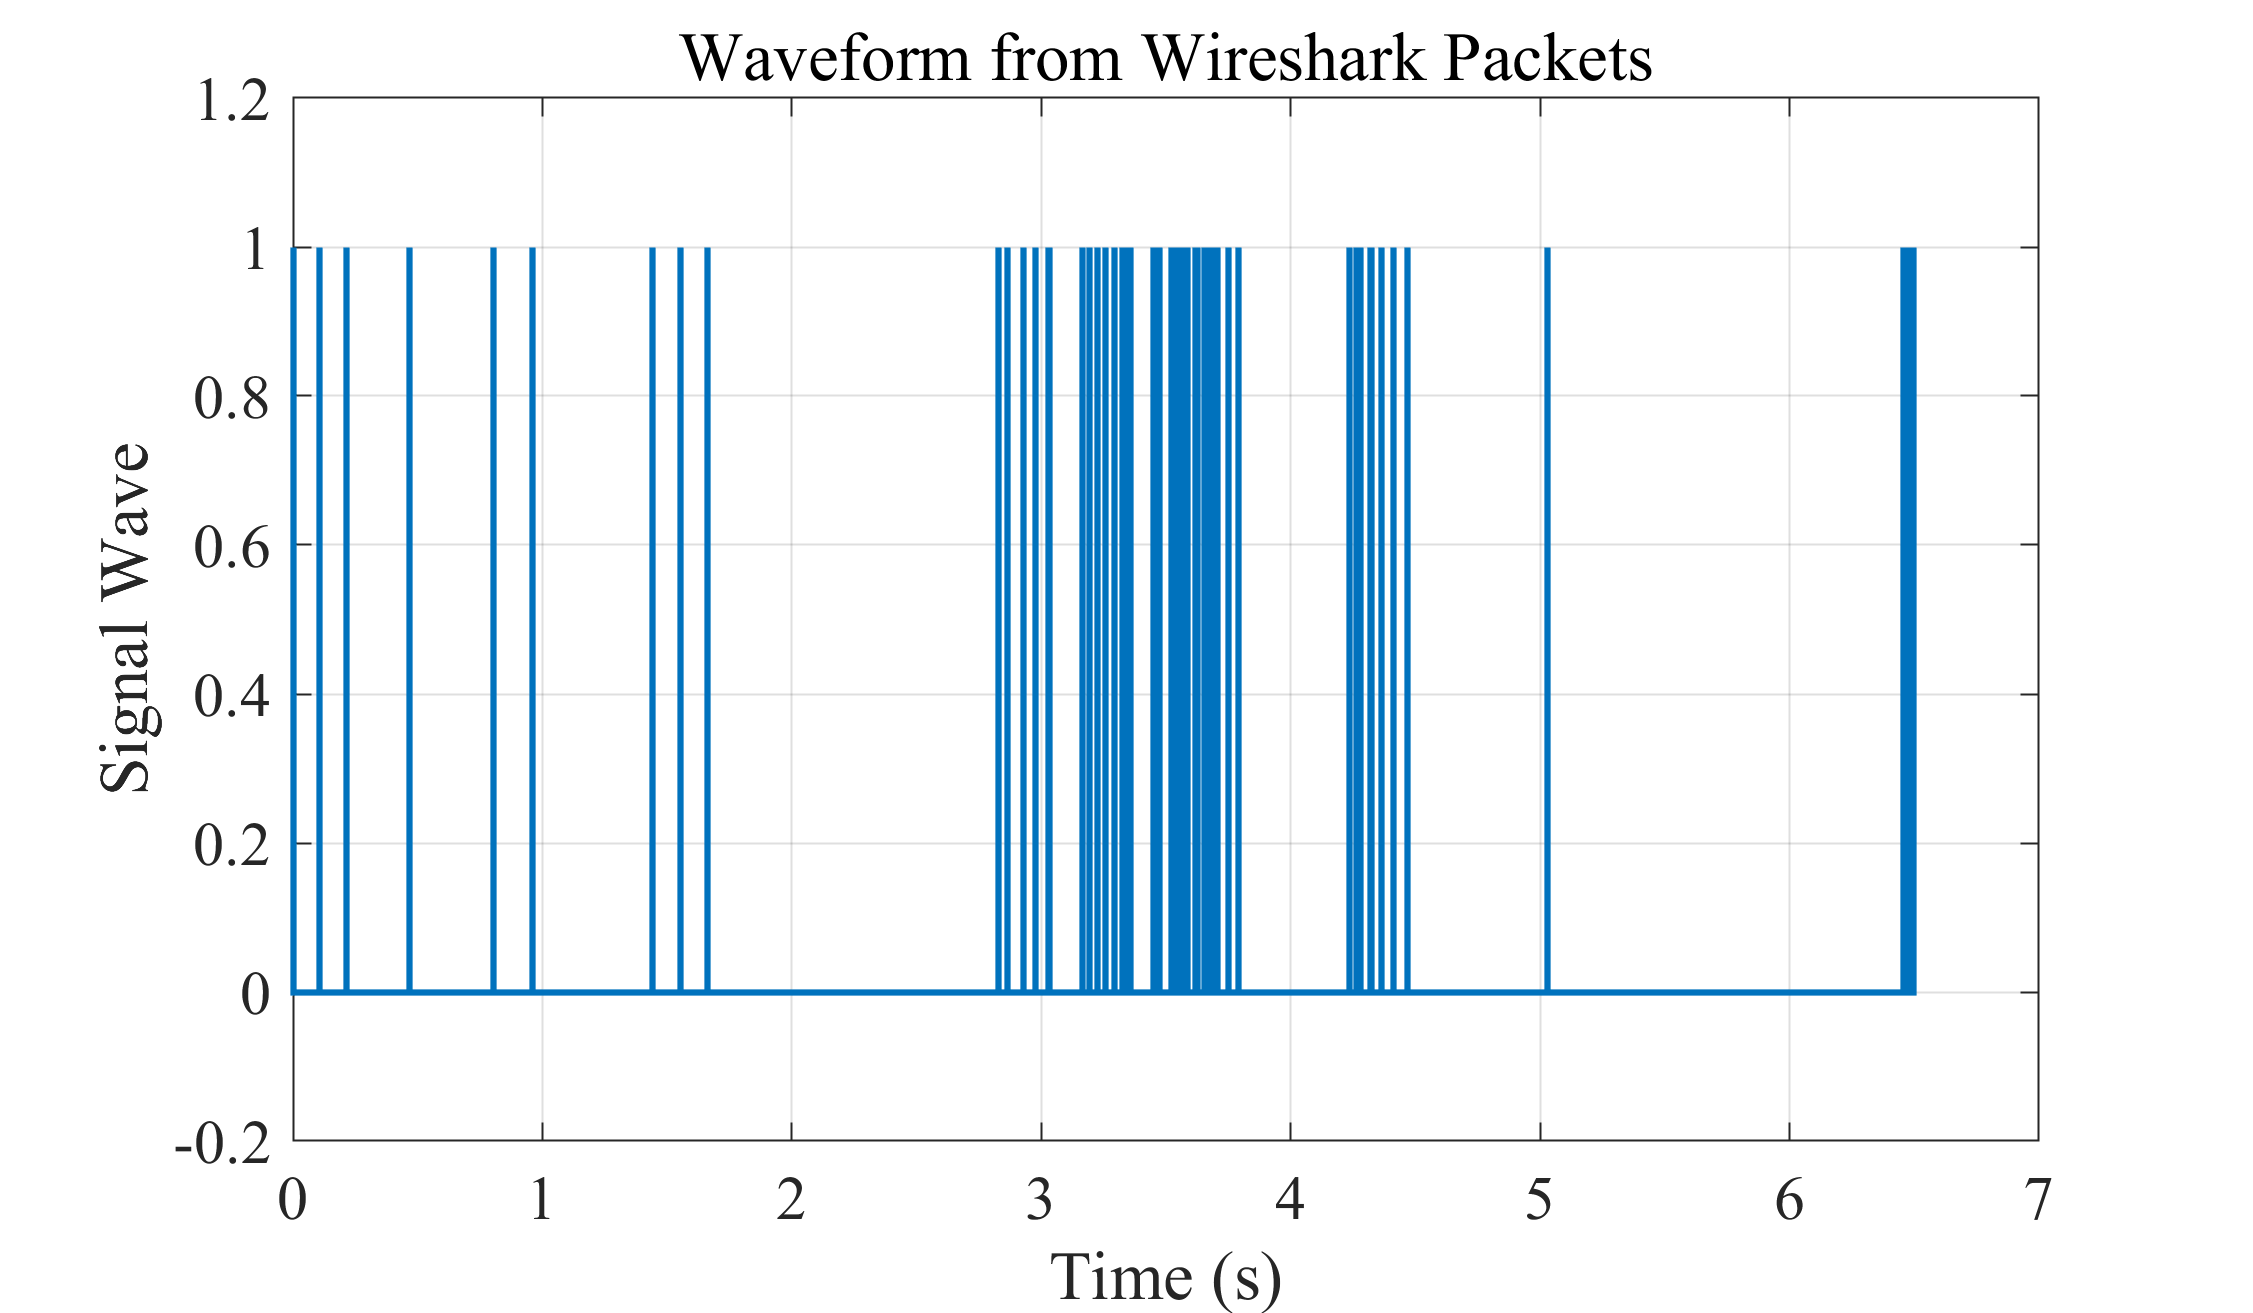
四、波形绘制
完成程序:
%zhouzhichao
%2025年8月19日
%把Wireshark捕获的数据绘制为波形图
clc
clear
close all
% 读取 Excel 文件
data = readtable('only time and length.xlsx');
% 查看前几行
head(data)
% 单独取出时间和长度
time = data.Time;
length = data.Length;
% 基本清洗
mask = ~isnan(time) & ~isnan(length);
time = time(mask);
length = length(mask);
%% 参数:每字节耗时
t_per_byte = 26.7e-9; % 26.7 ns/Byte
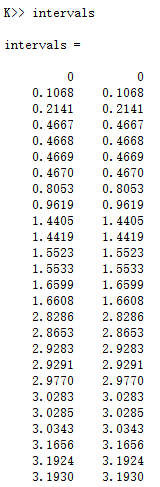
%% 计算每个包的起止时间
t_end = time(:);
t_start = t_end - length(:) .* t_per_byte;
% 若有负起点,截到 0(可按需要注释)
t_start = max(t_start, 0);
% 以起点升序排序
intervals = sortrows([t_start t_end], 1);
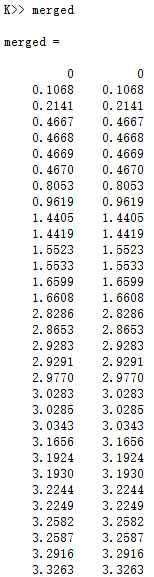
%% (可选)合并重叠或紧邻的区间,减少锯齿段数量
% “紧邻”的阈值(例如 < 1 ns 认为相连)
touch_eps = 1e-9; % 1 ns
merged = [];
for k = 1:size(intervals,1)
s = intervals(k,1); e = intervals(k,2);
if isempty(merged)
merged = [s e];
else
if s <= merged(end,2) + touch_eps
% 重叠/相邻:向后扩展
merged(end,2) = max(merged(end,2), e);
else
merged = [merged; s e];
end
end
end
%% 生成阶梯波形的 (t, y) 点列
t_plot = [];
y_plot = [];
for k = 1:size(merged,1)
s = merged(k,1); e = merged(k,2);
% 对于每个区间 [s, e],追加四个点: (s,0)->(s,1)->(e,1)->(e,0)
t_plot = [t_plot; s; s; e; e];
y_plot = [y_plot; 0; 1; 1; 0];
end
% 若希望在图上从 0 持续到首个 s 前也显示 0,可以在最前面加一个点
if ~isempty(t_plot)
t_plot = [min(0, t_plot(1)); t_plot];
y_plot = [0; y_plot];
end
%% 绘图
figure;
stairs(t_plot, y_plot, 'LineWidth', 1.5);
ylim([-0.2 1.2]);
xlabel('Time (s)');
ylabel('Signal Wave');
title('Waveform from Wireshark Packets');
grid on;
set(gca, 'FontName', 'Times New Roman')
set(gca, 'FontSize', 15);其中:
把起止时间转换为1,0波形:
%% 生成阶梯波形的 (t, y) 点列
t_plot = [];
y_plot = [];
for k = 1:size(merged,1)
    s = merged(k,1); e = merged(k,2);
    % 对于每个区间 [s, e],追加四个点: (s,0)->(s,1)->(e,1)->(e,0)
    t_plot = [t_plot; s; s; e; e];
    y_plot = [y_plot; 0; 1; 1; 0];
end

% 若希望在图上从 0 持续到首个 s 前也显示 0,可以在最前面加一个点
if ~isempty(t_plot)
    t_plot = [min(0, t_plot(1)); t_plot];
    y_plot = [0; y_plot];
end
起始时刻一下一上两个点,plot时就是一条竖线,结束时刻同理。起始和结束时刻之间一条横线。
波形绘制效果: