前三天,参加毕业典礼,领毕业证,顿时感到空落落的失去感,没有工作,啥也没有,总感觉一辈子白活了。晚上ktv了一晚上,由于我不咋个唱歌,没心情,听哥几个唱了一晚上周杰伦,回来的时候,还下大雨,躺在床上满满的失败感。
导入echartss
npm install echarts
然后在main.js中配置
import * as echarts from 'echarts';
//导入echats
Vue.prototype.$echarts = echarts;
对了,不要一味粘贴复制,因为我用的ruoyi框架的apis发送的请求,不是axios哦,还有我data中的参数,很多都是没用过的,是我中间思考,测试中没用的变量。
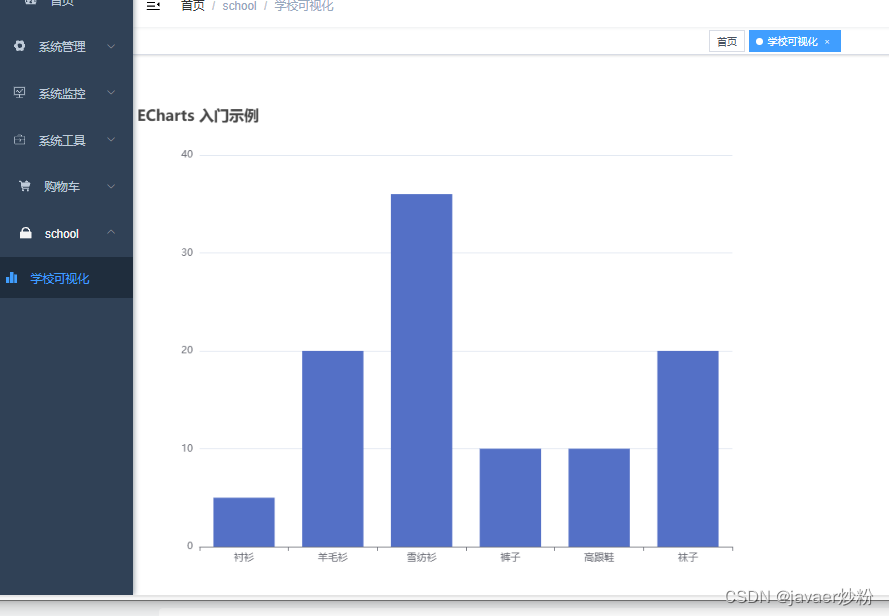
自己的界面先用一个案例
<template>
  <div id="app">
    <div id="myChart" :style="{width: '800px', height: '600px'}"></div>
  </div>
</template>

<script>
import * as echarts from "echarts";
import {listCar} from "@/api/shopcar/car";
import {listSchool, qryName} from "@/api/shool/school";
export default {
  data() {
    return {
      // 遮罩层
      loading: true,
      // 选中数组
      ids: [],
      // 非单个禁用
      single: true,
      // 非多个禁用
      multiple: true,
      // 显示搜索条件
      showSearch: true,
      // 总条数
      total: 0,
      // 【请填写功能名称】表格数据
      carList: [],
      //测试数组
      demoList:[],
      // 弹出层标题
      title: "",
      // 是否显示弹出层
      open: false,
      // 查询参数
      queryParams: {
        pageNum: 1,
        pageSize: 10,
        spuId: null,
        spuName: null,
        skuId: null,
        skuInfo: null,
        num: null,
        tenantId: null,
        tenantName: null,
        userId: null,
        username: null,
        isSelect: null,
        addPrice: null,
        price: null,
      },
      // 表单参数
      form: {},
      // 表单校验
      rules: {
      }
    }
  },
  created() {
    this.getList();
  },
  //钩子函数
  mounted() {
    this.draw();
    console.log(123456)
    console.log(this.carList)
  },
  methods: {
    getList() {
      this.loading = true;
      listSchool(this.queryParams).then(response => {
        console.log(12)
        console.log(response)
        this.carList = response.rows;
        console.log(this.carList)
        this.total = response.total;
        this.loading = false;
      });
    },
    getName() {
      this.loading = true;
      qryName().then(response => {
        console.log("name")
        console.log(response)
        this.demoList = response.rows
      });
    },
    draw() {
      // 初始化echarts实例
      let myChart = echarts.init(document.getElementById('myChart'))
      console.log(this.$echarts)
      myChart.setOption( {
        title: {
          text: 'ECharts 入门示例'
        },
        tooltip: {},
        xAxis: {
          data: ['衬衫', '羊毛衫', '雪纺衫', '裤子', '高跟鞋', '袜子']
        },
        yAxis: {},
        series: [
          {
            name: '销量',
            type: 'bar',
            data: [5, 20, 36, 10, 10, 20]
          }
        ]
      });
    }
  }
}
</script>

<style>
#app {
  font-family: Avenir, Helvetica, Arial, sans-serif;
  -webkit-font-smoothing: antialiased;
  -moz-osx-font-smoothing: grayscale;
  text-align: center;
  color: #2c3e50;
  margin-top: 60px;
}
</style>
调整了下代码,终于完成了前后端echars数据
因为数据太多了,有1000条,其实可以限制下不查那么多。
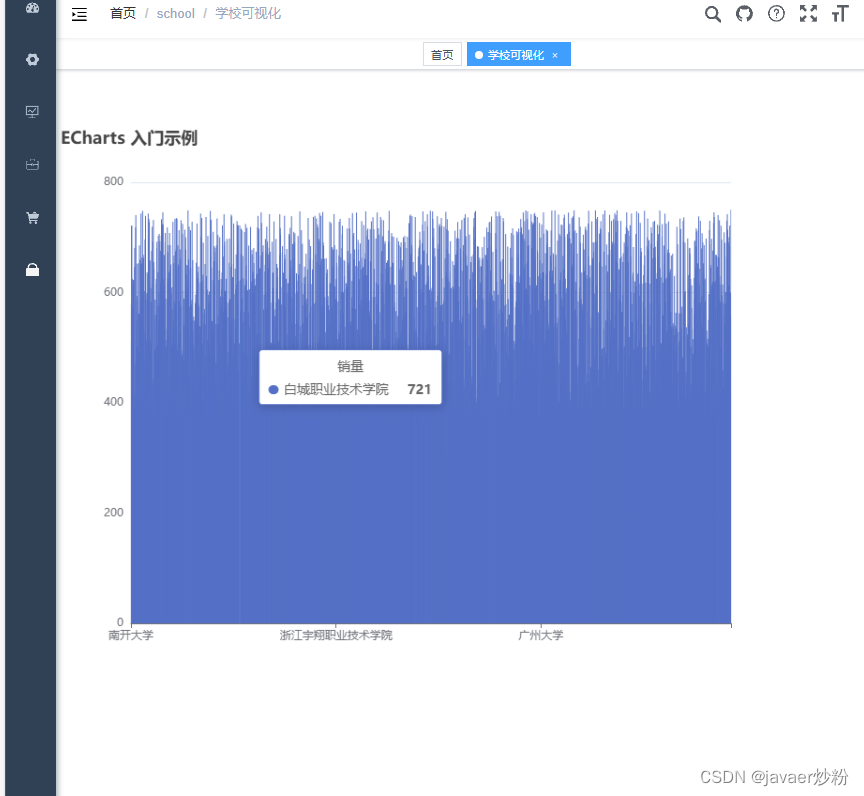
由于自己前端技术问题,迟迟不能完成前后端数据对照,所以很打脑壳,关于this,似乎只能在方法内部使用,全局并不能使用,所以我直接把echarts方法放在回调函数里面。
修改后的代码如下,大家可以参考下
前端当初没搞懂,后端就太简单了,返回一个map
<template>
  <div id="app">
    <div id="myChart" :style="{width: '800px', height: '600px'}"></div>
  </div>
</template>

<script>
import * as echarts from "echarts";
import {listCar} from "@/api/shopcar/car";
import {listSchool, qryName, qryScore} from "@/api/shool/school";
export default {
  data() {
    return {
      // 遮罩层
      loading: true,
      // 选中数组
      ids: [],
      // 非单个禁用
      single: true,
      // 非多个禁用
      multiple: true,
      // 显示搜索条件
      showSearch: true,
      // 总条数
      total: 0,
      // 【请填写功能名称】表格数据
      carList: [],
      //测试数组
      demoList:[],
      // 弹出层标题
      title: "",
      // 是否显示弹出层
      open: false,
      // 查询参数
      queryParams: {
        pageNum: 1,
        pageSize: 10,
        spuId: null,
        spuName: null,
        skuId: null,
        skuInfo: null,
        num: null,
        tenantId: null,
        tenantName: null,
        userId: null,
        username: null,
        isSelect: null,
        addPrice: null,
        price: null,
      },
      // 表单参数
      form: {},
      // 表单校验
      rules: {
      }
    }
  },
  created() {

  },
  //钩子函数
  mounted() {
  this.qryScore();
  },
  methods: {
    qryScore() {
      this.loading = true;
      qryScore().then(response => {
        console.log(1234)
        console.log(response)
        this.draw(response)
      });
    },
    draw(data) {
      // 初始化echarts实例
      let myChart = echarts.init(document.getElementById('myChart'))
      console.log(this.$echarts)
      myChart.setOption( {
        title: {
          text: 'ECharts 入门示例'
        },
        tooltip: {},
        xAxis: {
          data: data.name
        },
        yAxis: {},
        series: [
          {
            name: '销量',
            type: 'bar',
            data: data.grade
          }
        ]
      });
    }
  }
}
</script>

<style>
#app {
  font-family: Avenir, Helvetica, Arial, sans-serif;
  -webkit-font-smoothing: antialiased;
  -moz-osx-font-smoothing: grayscale;
  text-align: center;
  color: #2c3e50;
  margin-top: 60px;
}
</style>