电网数据管理与智能分析组件
1. 组件概述
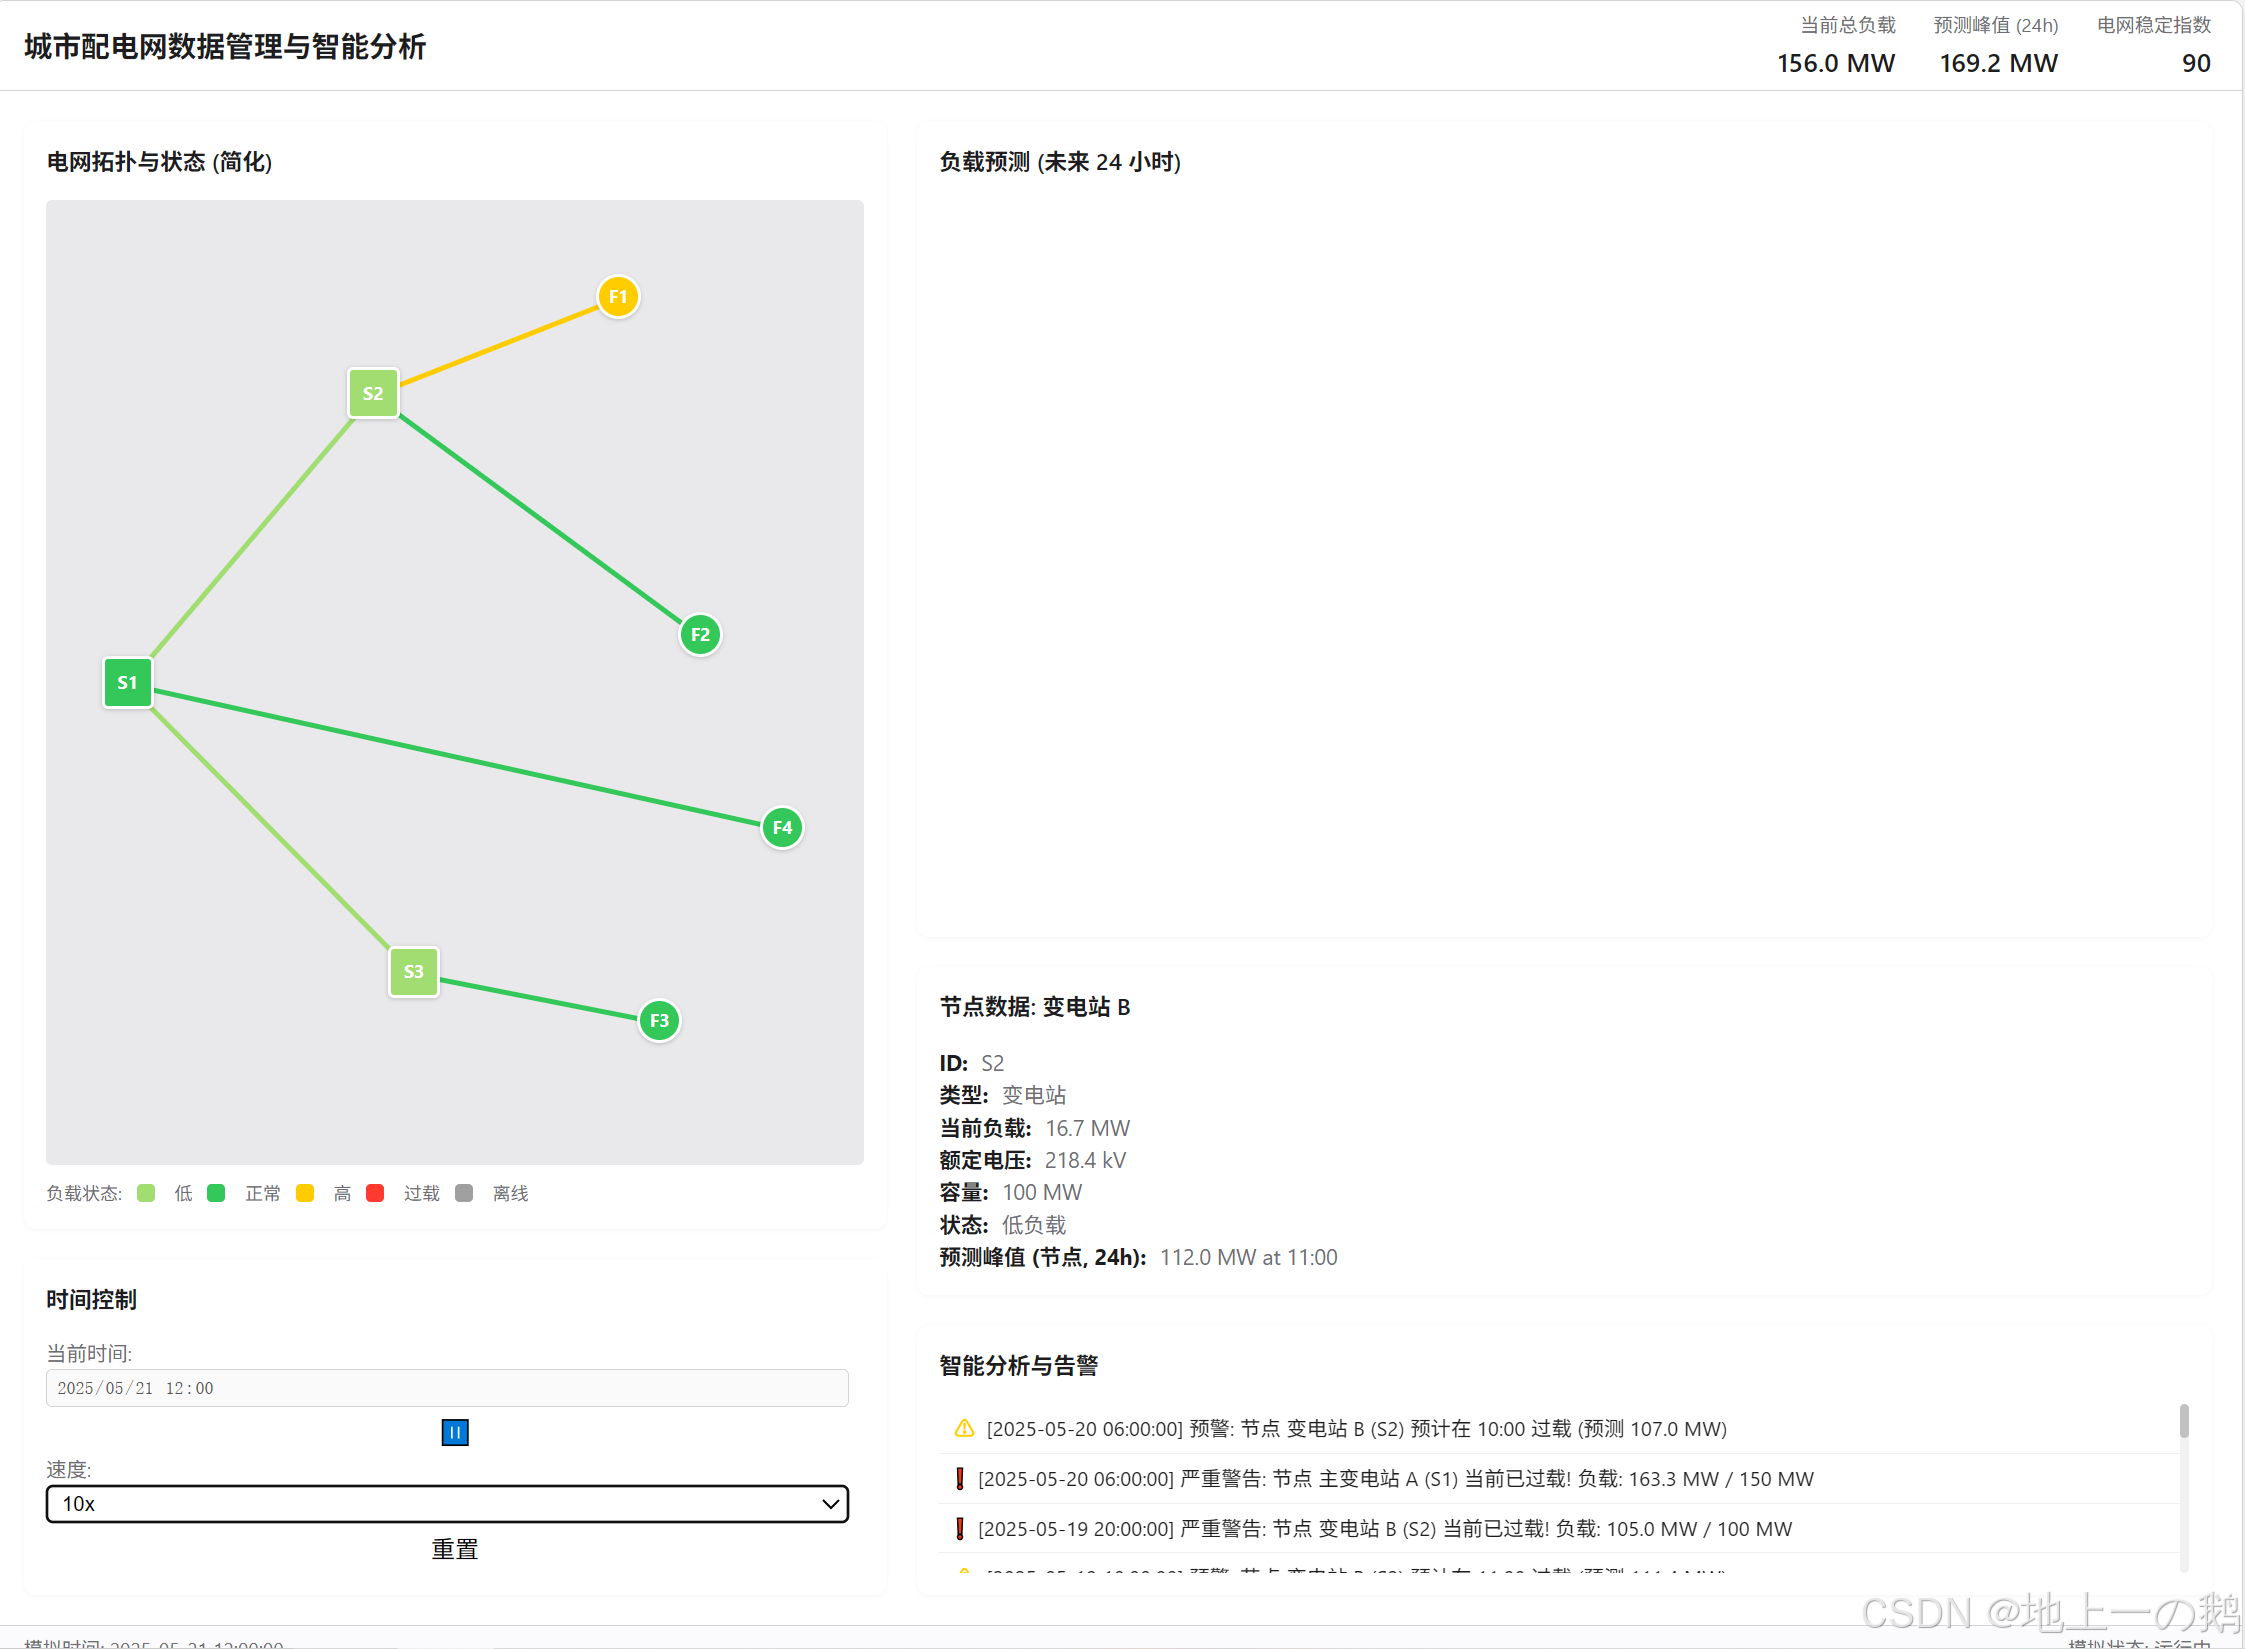
本组件旨在模拟一个城市配电网的运行状态,重点关注数据管理、可视化以及基于模拟数据的智能分析,特别是负载预测功能。用户可以通过界面交互式地探索电网拓扑、查看节点状态、控制时间演进,并观察系统生成的负载预测和相关告警。
设计风格遵循苹果科技工业美学,力求界面清晰、交互流畅、信息直观。
2. 主要功能
- 实时概览指标: 顶部显示当前电网总负载 (MW)、未来24小时预测峰值负载 (MW) 以及一个概念性的电网稳定指数。
- 电网拓扑可视化: 左侧区域使用简化的图形展示变电站和馈线的连接关系。节点和连接线的颜色会根据实时模拟的负载状态(低、正常、高、过载、离线)动态变化。
- 时间演进控制: 用户可以播放/暂停模拟时间的流逝,调整模拟速度(1x, 5x, 10x, 30x),或将时间重置到初始状态。
- 负载预测图表: 右上侧使用 Chart.js 图表展示选中节点(默认为总负载或首个馈线,点击拓扑图节点切换)的负载曲线,包括过去几小时的历史负载和未来24小时的预测负载。
- 节点详细数据: 点击左侧拓扑图中的节点(变电站或馈线),右侧中间面板会显示该节点的详细信息,如ID、名称、类型、当前负载、电压、容量(如有)、状态和预测峰值。
- 智能分析与告警: 右下侧面板根据当前的电网状态和预测结果,自动生成告警信息(如节点当前过载)和预警信息(如预测到未来几小时内可能发生过载),以及基于稳定指数的建议。
- 响应式布局: 界面适应不同宽度的浏览器窗口,在中小型屏幕上会自动调整布局,并控制整体高度防止内容过长。
3. 技术栈
- HTML5
- CSS3 (Flexbox, Grid, CSS Variables, Media Queries)
- JavaScript (ES6+)
- Chart.js (用于绘制图表)
- Day.js (用于日期和时间处理)
- chartjs-adapter-dayjs (Chart.js 的 Day.js 适配器)
4. 运行与使用
- 将
grid-data-smart-analysis文件夹放置在能源管理组件目录下。 - 在支持 HTML5 和 JavaScript 的浏览器中打开
index.html文件。 - 组件加载后,模拟处于暂停状态,显示初始电网拓扑和数据。
- 点击左下角的"播放"按钮 (▶️) 开始模拟时间的演进,观察拓扑图颜色、图表和告警信息的变化。
- 使用"暂停" (⏸️)、"速度"下拉框和"重置"按钮控制模拟进程。
- 点击左侧拓扑图中的任意节点(圆形代表馈线,方形代表变电站)来查看该节点的详细数据和负载预测曲线。
5. 模拟逻辑说明
- 电网拓扑: 在
script.js中定义了一个包含节点(变电站、馈线)和连接关系的简化电网结构。节点位置使用百分比定义,以便在不同尺寸下绘制。 - 负载模式: 每个"馈线"节点预定义了一个24小时的基础负载曲线 (
baseLoad) 和一个周末负载系数 (weekendMultiplier)。模拟器根据当前模拟时间(小时和星期几)来计算基础负载。 - 负载计算: 节点的实际负载 = 基础负载 * (1 +/- 随机波动%)。
- 变电站负载: 简单设定为其所连接的所有下游节点(馈线或其他变电站)的负载之和。
- 负载状态: 根据节点当前负载与其容量 (
capacity) 的比例,判定为低、正常、高或过载状态。 - 电压模拟: 仅模拟小幅度的随机波动,未与负载严格关联。
- 负载预测: 高度简化。对于馈线,基于其未来的基础负载模式进行预测,并加入微小波动。对于变电站,预测负载为其所连接馈线的预测负载之和。
- 总负载/峰值预测: 当前总负载为所有馈线负载之和;预测峰值为所有馈线预测负载在未来24小时内的最大总和。
- 稳定指数: 基于当前过载和高负载节点的数量计算出的概念性分数。
- 告警/预警: 基于当前节点是否过载,以及预测负载是否会超过节点容量来生成。
6. 注意事项
- 这是一个高度简化的概念性模拟,其电网拓扑、负载模型、电压模拟和特别是负载预测算法都与实际电力系统工程相去甚远。
- 主要目的是演示一个集成化的电网数据监控与分析界面的设计思路、交互方式和数据可视化效果。
- 所有数据均为程序生成,不代表任何真实的电网运行数据。
效果展示
源码
index.html
<!DOCTYPE html>
<html lang="zh-CN">
<head>
    <meta charset="UTF-8">
    <meta name="viewport" content="width=device-width, initial-scale=1.0">
    <title>电网数据管理与智能分析</title>
    <link rel="stylesheet" href="styles.css">
    <!-- Script loading order changed -->
    <script src="https://cdn.jsdelivr.net/npm/dayjs@1/dayjs.min.js"></script> <!-- 1. Day.js Core -->
    <script src="https://cdn.jsdelivr.net/npm/chartjs-adapter-dayjs@1/dist/chartjs-adapter-dayjs.bundle.min.js"></script> <!-- 2. Day.js Adapter -->
    <script src="https://cdn.jsdelivr.net/npm/chart.js"></script> <!-- 3. Chart.js -->
</head>
<body>
    <div class="container">
        <header class="overview-bar">
            <h1>城市配电网数据管理与智能分析</h1>
            <div class="metrics">
                <div class="metric-item">
                    <span class="label">当前总负载</span>
                    <span class="value" id="currentTotalLoad">-- MW</span>
                </div>
                <div class="metric-item">
                    <span class="label">预测峰值 (24h)</span>
                    <span class="value" id="predictedPeakLoad">-- MW</span>
                </div>
                <div class="metric-item">
                    <span class="label">电网稳定指数</span>
                    <span class="value" id="gridStabilityIndex">--</span>
                     <span class="tooltip">概念性指标,越高越稳定</span>
                </div>
            </div>
        </header>

        <main class="main-content">
            <section class="grid-visualization-section">
                <div class="topology-container">
                    <h2>电网拓扑与状态 (简化)</h2>
                    <div class="topology-map" id="topologyMap">
                        <!-- Grid nodes and lines will be generated by JS -->
                        <p>正在加载电网拓扑...</p>
                    </div>
                    <div class="legend">
                        <span>负载状态:</span>
                        <span class="legend-item low"></span> 低
                        <span class="legend-item normal"></span> 正常
                        <span class="legend-item high"></span> 高
                        <span class="legend-item overload"></span> 过载
                        <span class="legend-item offline"></span> 离线
                    </div>
                </div>
                <div class="time-control-panel">
                    <h2>时间控制</h2>
                     <label for="currentDateTime">当前时间:</label>
                     <input type="datetime-local" id="currentDateTime" disabled>
                     <button id="playPauseBtn" title="播放/暂停时间演进">▶️</button>
                     <label for="timeSpeed">速度:</label>
                     <select id="timeSpeed">
                         <option value="1">1x</option>
                         <option value="5">5x</option>
                         <option value="10">10x</option>
                         <option value="30">30x</option>
                     </select>
                     <button id="resetTimeBtn" title="重置时间">重置</button>
                </div>
            </section>

            <section class="data-analysis-section">
                <div class="chart-container load-forecast-container">
                    <h2>负载预测 (未来 24 小时)</h2>
                    <canvas id="loadForecastChart"></canvas>
                </div>
                <div class="node-data-panel">
                    <h2>节点数据: <span id="selectedNodeName">未选择</span></h2>
                    <div id="nodeDetails">
                        <p>请在左侧拓扑图中选择一个节点查看详细数据。</p>
                        <!-- Details like Current Load, Voltage, Predicted Peak, Status -->
                    </div>
                </div>
                 <div class="analysis-alerts-panel">
                    <h2>智能分析与告警</h2>
                    <ul id="alertList">
                        <li>系统初始化完成,等待数据...</li>
                        <!-- Analysis results and alerts will be added by JS -->
                    </ul>
                </div>
            </section>
        </main>

         <footer class="status-bar">
            <span>模拟时间: <span id="simulationTime">--</span></span>
            <span>模拟状态: <span id="simulationStatus">已暂停</span></span>
        </footer>
    </div>

    <script src="script.js"></script> <!-- 4. Your main script -->
</body>
</html>
styles.css
:root {
    --bg-color: #f5f5f7;
    --panel-bg-color: #ffffff;
    --border-color: #d2d2d7;
    --text-color-primary: #1d1d1f;
    --text-color-secondary: #6e6e73;
    --accent-blue: #007aff;
    --accent-green: #34c759;
    --accent-yellow: #ffcc00;
    --accent-orange: #ff9500;
    --accent-red: #ff3b30;
    --font-family: -apple-system, BlinkMacSystemFont, "Segoe UI", Roboto, Helvetica, Arial, sans-serif;
    --border-radius: 8px;
    --container-padding: 20px;
    --panel-padding: 15px;
    --header-height: 60px;
    --footer-height: 30px; /* Smaller footer */

    /* Grid status colors */
    --load-low-color: #a1dd70;
    --load-normal-color: var(--accent-green);
    --load-high-color: var(--accent-yellow);
    --load-overload-color: var(--accent-red);
    --load-offline-color: #a0a0a0;
}

* {
    box-sizing: border-box;
    margin: 0;
    padding: 0;
}

body {
    font-family: var(--font-family);
    background-color: var(--bg-color);
    color: var(--text-color-primary);
    line-height: 1.5;
    display: flex;
    justify-content: center;
    align-items: flex-start;
    min-height: 100vh;
    padding: 20px;
}

.container {
    width: 100%;
    max-width: 1500px; /* Slightly wider for grid layout */
    background-color: var(--panel-bg-color);
    border-radius: var(--border-radius);
    border: 1px solid var(--border-color);
    box-shadow: 0 4px 12px rgba(0, 0, 0, 0.08);
    overflow: hidden;
    display: flex;
    flex-direction: column;
}

/* Header / Overview Bar */
.overview-bar {
    display: flex;
    justify-content: space-between;
    align-items: center;
    padding: 0 var(--container-padding);
    height: var(--header-height);
    border-bottom: 1px solid var(--border-color);
    background-color: #ffffff;
}

.overview-bar h1 {
    font-size: 1.2em;
    font-weight: 600;
    color: var(--text-color-primary);
    white-space: nowrap;
    overflow: hidden;
    text-overflow: ellipsis;
    margin-right: 20px;
}

.metrics {
    display: flex;
    gap: 25px;
    flex-shrink: 0; /* Prevent metrics from shrinking */
}

.metric-item {
    display: flex;
    flex-direction: column;
    align-items: flex-end;
    position: relative; /* For tooltip */
}

.metric-item .label {
    font-size: 0.8em;
    color: var(--text-color-secondary);
    margin-bottom: 2px;
}

.metric-item .value {
    font-size: 1.1em;
    font-weight: 600;
    color: var(--text-color-primary);
}

.metric-item .tooltip {
    position: absolute;
    bottom: 100%; /* Position above the item */
    left: 50%;
    transform: translateX(-50%);
    background-color: rgba(0, 0, 0, 0.7);
    color: white;
    padding: 3px 6px;
    border-radius: 4px;
    font-size: 0.7em;
    white-space: nowrap;
    opacity: 0;
    visibility: hidden;
    transition: opacity 0.2s ease, visibility 0.2s ease;
    margin-bottom: 5px;
    pointer-events: none; /* Prevent tooltip from blocking clicks */
}

.metric-item:hover .tooltip {
    opacity: 1;
    visibility: visible;
}


/* Main Content Area */
.main-content {
    display: flex;
    flex: 1;
    padding: var(--container-padding);
    gap: var(--container-padding);
    min-height: 450px; /* Minimum height for layout */
}

.grid-visualization-section {
    flex: 2; /* Left side takes less space */
    display: flex;
    flex-direction: column;
    gap: var(--container-padding);
}

.data-analysis-section {
    flex: 3; /* Right side takes more space */
    display: flex;
    flex-direction: column;
    gap: var(--container-padding);
}

/* Panels within sections */
.topology-container,
.time-control-panel,
.chart-container,
.node-data-panel,
.analysis-alerts-panel {
    background-color: var(--panel-bg-color);
    border-radius: var(--border-radius);
    padding: var(--panel-padding);
    box-shadow: 0 1px 3px rgba(0,0,0,0.04);
    display: flex;
    flex-direction: column; /* Default to column layout */
}

.topology-container h2,
.time-control-panel h2,
.chart-container h2,
.node-data-panel h2,
.analysis-alerts-panel h2 {
    font-size: 0.95em;
    font-weight: 600;
    margin-bottom: 15px;
    color: var(--text-color-primary);
    flex-shrink: 0; /* Prevent title shrinking */
}

/* Left Side Panels */
.topology-container {
    flex-grow: 1; /* Allow topology to take available space */
    min-height: 300px; /* Ensure space for map */
}

.topology-map {
    flex-grow: 1;
    background-color: #e9e9eb;
    border-radius: 4px;
    position: relative; /* For positioning nodes/lines */
    overflow: auto; /* Allow scroll if content exceeds */
    display: flex; /* Center initial message */
    justify-content: center;
    align-items: center;
    color: var(--text-color-secondary);
}

/* Simple placeholder styling for nodes/lines - JS will handle real elements */
.grid-node {
    position: absolute;
    width: 30px;
    height: 30px;
    border-radius: 50%;
    background-color: var(--accent-blue);
    border: 2px solid white;
    box-shadow: 0 1px 3px rgba(0,0,0,0.2);
    display: flex;
    justify-content: center;
    align-items: center;
    font-size: 0.7em;
    font-weight: bold;
    color: white;
    cursor: pointer;
    transition: transform 0.2s ease, background-color 0.3s ease;
    z-index: 2;
}
.grid-node:hover {
    transform: scale(1.1);
}
.grid-node.selected {
    border-color: var(--accent-orange);
    box-shadow: 0 0 8px var(--accent-orange);
}

.grid-line {
    position: absolute;
    background-color: var(--text-color-secondary);
    height: 3px; /* Line thickness */
    transform-origin: left center;
    z-index: 1;
    transition: background-color 0.3s ease;
}

/* Node status colors (applied via JS) */
.grid-node.low, .grid-line.low { background-color: var(--load-low-color); }
.grid-node.normal, .grid-line.normal { background-color: var(--load-normal-color); }
.grid-node.high, .grid-line.high { background-color: var(--load-high-color); }
.grid-node.overload, .grid-line.overload { background-color: var(--load-overload-color); }
.grid-node.offline, .grid-line.offline { background-color: var(--load-offline-color); }

/* Legend Styling */
.legend {
    margin-top: 10px;
    font-size: 0.75em;
    display: flex;
    align-items: center;
    flex-wrap: wrap;
    gap: 5px 10px;
    color: var(--text-color-secondary);
    flex-shrink: 0;
}
.legend-item {
    display: inline-block;
    width: 12px;
    height: 12px;
    border-radius: 3px;
    margin-right: 3px;
    vertical-align: middle;
}
.legend-item.low { background-color: var(--load-low-color); }
.legend-item.normal { background-color: var(--load-normal-color); }
.legend-item.high { background-color: var(--load-high-color); }
.legend-item.overload { background-color: var(--load-overload-color); }
.legend-item.offline { background-color: var(--load-offline-color); }

.time-control-panel {
    flex-shrink: 0; /* Prevent panel from shrinking */
}
.time-control-panel label {
    font-size: 0.85em;
    margin-right: 5px;
    color: var(--text-color-secondary);
}
.time-control-panel input[type="datetime-local"],
.time-control-panel select {
    font-size: 0.85em;
    padding: 4px 6px;
    border: 1px solid var(--border-color);
    border-radius: 4px;
    margin-right: 10px;
}
.time-control-panel button {
    font-size: 1em;
    background: none;
    border: none;
    cursor: pointer;
    padding: 5px;
    margin: 0 5px;
    vertical-align: middle;
}
.time-control-panel button:hover {
    opacity: 0.7;
}

/* Right Side Panels */
.load-forecast-container {
    flex-grow: 2; /* Chart takes more space */
    min-height: 250px;
}
.node-data-panel {
    flex-grow: 1;
    min-height: 100px;
}
.analysis-alerts-panel {
    flex-grow: 1;
    max-height: 180px; /* Limit height */
    overflow-y: auto;
}

.chart-container canvas {
    max-width: 100%;
    flex-grow: 1; /* Allow canvas to fill container */
}

#nodeDetails p {
    font-size: 0.9em;
    color: var(--text-color-secondary);
}
#nodeDetails strong {
    color: var(--text-color-primary);
}
#nodeDetails span {
     margin-left: 5px;
}

/* Alerts List Styling (similar to previous component) */
#alertList {
    list-style: none;
    padding: 0;
    font-size: 0.85em;
    flex-grow: 1;
    overflow-y: auto; /* Scroll within the list */
}

#alertList li {
    padding: 6px 10px;
    border-bottom: 1px solid #eee;
    display: flex;
    align-items: center;
    gap: 8px;
}

#alertList li:last-child {
    border-bottom: none;
}

/* Alert types styling */
.alert-info::before { content: "\2139"; color: var(--accent-blue); font-weight: bold; }
.alert-warning::before { content: "\26A0"; color: var(--accent-yellow); font-weight: bold; }
.alert-critical::before { content: "\2757"; color: var(--accent-red); font-weight: bold; }
.alert-suggestion::before { content: "\1F4A1"; color: var(--accent-green); }

/* Footer / Status Bar */
.status-bar {
    display: flex;
    justify-content: space-between;
    align-items: center;
    padding: 0 var(--container-padding);
    height: var(--footer-height);
    border-top: 1px solid var(--border-color);
    background-color: #fbfbfd;
    font-size: 0.8em;
    color: var(--text-color-secondary);
}

/* Scrollbar Styling (optional, Webkit) */
::-webkit-scrollbar {
    width: 6px;
    height: 6px;
}
::-webkit-scrollbar-track {
    background: #f1f1f1;
    border-radius: 3px;
}
::-webkit-scrollbar-thumb {
    background: #c1c1c1;
    border-radius: 3px;
}
::-webkit-scrollbar-thumb:hover {
    background: #a8a8a8;
}

/* Responsive Adjustments */
@media (max-width: 1200px) {
    .metrics {
        gap: 15px;
    }
     .metric-item .value {
        font-size: 1em;
    }
}

@media (max-width: 992px) {
    .main-content {
        flex-direction: column;
        min-height: auto;
    }
    .grid-visualization-section,
    .data-analysis-section {
        flex: none;
        width: 100%;
    }
    .topology-container {
        min-height: 250px;
    }
     .analysis-alerts-panel {
        max-height: 150px;
    }
}

@media (max-width: 768px) {
    body {
        padding: 10px;
    }
    .container {
        border-radius: 0;
        border-left: none;
        border-right: none;
    }
    .overview-bar {
        flex-direction: column;
        height: auto;
        padding: 10px var(--panel-padding);
        align-items: flex-start;
    }
    .overview-bar h1 {
        margin-bottom: 10px;
    }
    .metrics {
        width: 100%;
        justify-content: space-between;
        gap: 10px;
    }
     .metric-item {
         align-items: center; /* Center metrics on mobile */
     }

    .main-content {
        padding: var(--panel-padding);
    }
    .grid-visualization-section, .data-analysis-section {
        gap: var(--panel-padding);
    }
    .time-control-panel {
        display: flex;
        flex-wrap: wrap;
        gap: 10px;
    }
     .time-control-panel input,
     .time-control-panel select,
     .time-control-panel button {
         margin-right: 0;
     }
}

@media (max-width: 480px) {
    .metrics {
        flex-wrap: wrap;
        justify-content: center;
    }
    .metric-item {
        flex-basis: 45%;
        align-items: center;
        margin-bottom: 5px;
    }
    .overview-bar h1 {
         font-size: 1.1em;
    }
}
script.js
document.addEventListener('DOMContentLoaded', () => {
// --- DOM Elements ---
const currentTotalLoadSpan = document.getElementById('currentTotalLoad');
const predictedPeakLoadSpan = document.getElementById('predictedPeakLoad');
const gridStabilityIndexSpan = document.getElementById('gridStabilityIndex');
const topologyMapDiv = document.getElementById('topologyMap');
const currentDateTimeInput = document.getElementById('currentDateTime');
const playPauseBtn = document.getElementById('playPauseBtn');
const timeSpeedSelect = document.getElementById('timeSpeed');
const resetTimeBtn = document.getElementById('resetTimeBtn');
const loadForecastCanvas = document.getElementById('loadForecastChart');
const selectedNodeNameSpan = document.getElementById('selectedNodeName');
const nodeDetailsDiv = document.getElementById('nodeDetails');
const alertListUl = document.getElementById('alertList');
const simulationTimeSpan = document.getElementById('simulationTime');
const simulationStatusSpan = document.getElementById('simulationStatus');
// --- Simulation Configuration ---
const config = {
startTime: dayjs().startOf('day').toDate(), // Start at beginning of today
updateIntervalMs: 1000, // Real-time update interval
forecastHorizonHours: 24,
historicalHours: 6, // How many hours of history to show on chart
nodeClickHighlightDuration: 5000, // ms
// Simplified grid structure
grid: {
nodes: [
{ id: 'S1', name: '主变电站 A', type: 'substation', x: 10, y: 50, capacity: 150 },
{ id: 'S2', name: '变电站 B', type: 'substation', x: 40, y: 20, capacity: 100 },
{ id: 'S3', name: '变电站 C', type: 'substation', x: 45, y: 80, capacity: 120 },
{ id: 'F1', name: '馈线 1 (商业区)', type: 'feeder', x: 70, y: 10, baseLoad: [10, 8, 7, 6, 7, 8, 15, 25, 35, 40, 45, 50, 48, 45, 42, 40, 38, 42, 48, 45, 35, 25, 18, 12], weekendMultiplier: 0.6, capacity: 60 },
{ id: 'F2', name: '馈线 2 (工业区)', type: 'feeder', x: 80, y: 45, baseLoad: [15, 12, 10, 10, 12, 15, 20, 30, 45, 55, 60, 60, 55, 50, 48, 45, 40, 35, 30, 25, 20, 18, 16, 15], weekendMultiplier: 0.4, capacity: 70 },
{ id: 'F3', name: '馈线 3 (居民区)', type: 'feeder', x: 75, y: 85, baseLoad: [8, 6, 5, 5, 6, 8, 12, 18, 25, 28, 30, 32, 30, 28, 25, 28, 35, 45, 50, 45, 35, 25, 15, 10], weekendMultiplier: 1.1, capacity: 60 },
{ id: 'F4', name: '馈线 4 (混合区)', type: 'feeder', x: 90, y: 65, baseLoad: [5, 4, 4, 4, 5, 7, 10, 15, 20, 22, 25, 26, 25, 24, 22, 23, 28, 35, 38, 35, 28, 20, 12, 8], weekendMultiplier: 0.9, capacity: 50 },
],
// Connections define power flow directionality for simulation
connections: [
{ from: 'S1', to: 'S2' },
{ from: 'S1', to: 'S3' },
{ from: 'S2', to: 'F1' },
{ from: 'S2', to: 'F2' },
{ from: 'S3', to: 'F3' },
{ from: 'S1', to: 'F4' } // Direct feeder from main substation
]
},
loadFluctuationPercent: 5, // +/- 5% random fluctuation
voltageFluctuationPercent: 1, // +/- 1% random fluctuation from nominal 220kV/10kV etc.
stabilityThresholds: { // For calculating stability index
overloadCount: 3, // Max allowed overloaded nodes for high stability
highLoadCount: 5, // Max allowed high-load nodes
}
};
// --- Simulation State ---
let currentTime = dayjs(config.startTime);
let simulationRunning = false;
let simulationSpeed = 1;
let simulationTimer = null;
let gridState = {}; // { nodeId: { load, voltage, status, forecast[...] }, ... }
let selectedNodeId = null;
let nodeElements = {}; // Store DOM elements for nodes
let lineElements = {}; // Store DOM elements for lines
// --- Chart Instance ---
let loadForecastChart = null;
// --- Utility Functions ---
function getRandom(min, max) {
return Math.random() * (max - min) + min;
}
function formatDateTime(date) {
return dayjs(date).format('YYYY-MM-DD HH:mm:ss');
}
function formatLocalDateTimeForInput(date) {
// HTML datetime-local input needs YYYY-MM-DDTHH:mm
return dayjs(date).format('YYYY-MM-DDTHH:mm');
}
// *** NEW Helper function to aggregate data points ***
function aggregateDataPoints(dataArrays) {
const aggregatedMap = new Map(); // Map<timestamp_ms, totalLoad>
const timePoints = new Set(); // Store unique timestamps in order
dataArrays.forEach(arr => {
if (!arr) return; // Skip if array is null or undefined
arr.forEach(point => {
if (!point || !point.time) return; // Skip invalid points
const timestampMs = point.time.getTime();
const currentLoad = aggregatedMap.get(timestampMs) || 0;
aggregatedMap.set(timestampMs, currentLoad + point.load);
timePoints.add(timestampMs);
});
});
// Sort timestamps and create the final array
const sortedTimestamps = Array.from(timePoints).sort((a, b) => a - b);
return sortedTimestamps.map(ts => ({
time: new Date(ts),
load: aggregatedMap.get(ts)
}));
}
// --- Initialization ---
function initializeGridState() {
gridState = {};
config.grid.nodes.forEach(node => {
gridState[node.id] = {
load: 0,
voltage: node.type === 'substation' ? 220 : 10, // Simplified nominal voltage kV
status: 'normal', // normal, low, high, overload, offline
forecast: [], // Array of { time, load }
config: node // Reference to static config
};
});
}
function initializeChart() {
if (loadForecastChart) loadForecastChart.destroy();
const ctx = loadForecastCanvas.getContext('2d');
loadForecastChart = new Chart(ctx, {
type: 'line',
data: {
// labels: [], // Handled by time scale
datasets: [
{
label: '历史负载 (MW)',
data: [], // { x: time, y: load }
borderColor: 'rgba(0, 122, 255, 0.8)',
backgroundColor: 'transparent',
borderWidth: 2,
pointRadius: 0,
tension: 0.1
},
{
label: '预测负载 (MW)',
data: [], // { x: time, y: load }
borderColor: 'rgba(255, 149, 0, 0.8)', // Orange
backgroundColor: 'transparent',
borderDash: [5, 5], // Dashed line for forecast
borderWidth: 2,
pointRadius: 0,
tension: 0.1
}
]
},
options: {
responsive: true,
maintainAspectRatio: false,
animation: { duration: 0 }, // Disable animation for performance
scales: {
x: {
type: 'time',
time: {
unit: 'hour',
tooltipFormat: 'YYYY-MM-DD HH:mm', // Format for tooltips
displayFormats: { hour: 'HH:mm' }
},
title: { display: true, text: '时间' },
ticks: { source: 'auto', maxRotation: 0, autoSkipPadding: 20 }
},
y: {
beginAtZero: true,
title: { display: true, text: '负载 (MW)' }
}
},
plugins: {
legend: { position: 'top' },
tooltip: { mode: 'index', intersect: false }
},
interaction: { mode: 'nearest', axis: 'x', intersect: false }
}
});
}
function drawGridTopology() {
topologyMapDiv.innerHTML = ''; // Clear previous
nodeElements = {};
lineElements = {};
const mapWidth = topologyMapDiv.clientWidth;
const mapHeight = topologyMapDiv.clientHeight;
// Create lines first (so they are behind nodes)
config.grid.connections.forEach((conn, index) => {
const fromNode = config.grid.nodes.find(n => n.id === conn.from);
const toNode = config.grid.nodes.find(n => n.id === conn.to);
if (!fromNode || !toNode) return;
const x1 = (fromNode.x / 100) * mapWidth;
const y1 = (fromNode.y / 100) * mapHeight;
const x2 = (toNode.x / 100) * mapWidth;
const y2 = (toNode.y / 100) * mapHeight;
const angle = Math.atan2(y2 - y1, x2 - x1) * 180 / Math.PI;
const length = Math.sqrt(Math.pow(x2 - x1, 2) + Math.pow(y2 - y1, 2));
const line = document.createElement('div');
line.classList.add('grid-line');
line.style.left = `${x1}px`;
line.style.top = `${y1}px`;
line.style.width = `${length}px`;
line.style.transform = `rotate(${angle}deg)`;
const lineId = `line-${conn.from}-${conn.to}`;
line.id = lineId;
lineElements[lineId] = line;
topologyMapDiv.appendChild(line);
});
// Create nodes
config.grid.nodes.forEach(node => {
const nodeEl = document.createElement('div');
nodeEl.classList.add('grid-node');
nodeEl.dataset.nodeId = node.id;
nodeEl.id = `node-${node.id}`;
nodeEl.textContent = node.id; // Simple ID display
nodeEl.title = node.name; // Tooltip
nodeEl.style.left = `calc(${(node.x / 100) * 100}% - 15px)`; // Center the node (width/2)
nodeEl.style.top = `calc(${(node.y / 100) * 100}% - 15px)`; // Center the node (height/2)
if (node.type === 'substation') {
nodeEl.style.borderRadius = '4px'; // Square for substations
nodeEl.style.width = '35px';
nodeEl.style.height = '35px';
nodeEl.style.left = `calc(${(node.x / 100) * 100}% - 17.5px)`;
nodeEl.style.top = `calc(${(node.y / 100) * 100}% - 17.5px)`;
}
nodeEl.addEventListener('click', () => handleNodeClick(node.id));
nodeElements[node.id] = nodeEl;
topologyMapDiv.appendChild(nodeEl);
});
}
// --- Simulation Loop ---
function simulationStep() {
if (!simulationRunning) return;
const timeIncrementSeconds = 3600 * simulationSpeed; // Advance by hours based on speed
currentTime = dayjs(currentTime).add(timeIncrementSeconds, 'second');
updateGridState(currentTime);
updateUI();
// Schedule next step
simulationTimer = setTimeout(simulationStep, config.updateIntervalMs);
}
function updateGridState(time) {
const hourOfDay = time.hour();
const dayOfWeek = time.day(); // 0 = Sunday, 6 = Saturday
const isWeekend = (dayOfWeek === 0 || dayOfWeek === 6);
let totalLoad = 0;
let overloadCount = 0;
let highLoadCount = 0;
let activeNodes = 0;
config.grid.nodes.forEach(node => {
const state = gridState[node.id];
if (state.status === 'offline') return;
let currentBaseLoad = 0;
if (node.type === 'feeder' && node.baseLoad) {
currentBaseLoad = node.baseLoad[hourOfDay] * (isWeekend ? node.weekendMultiplier : 1);
} else if (node.type === 'substation') {
// Substation load is sum of loads it feeds (simplified)
currentBaseLoad = config.grid.connections
.filter(c => c.from === node.id)
.reduce((sum, conn) => sum + (gridState[conn.to]?.load || 0), 0);
}
// Add fluctuation
state.load = currentBaseLoad * (1 + getRandom(-config.loadFluctuationPercent / 100, config.loadFluctuationPercent / 100));
state.load = Math.max(0, state.load); // Cannot be negative
// Simulate voltage fluctuation (simple)
const baseVoltage = node.type === 'substation' ? 220 : 10;
state.voltage = baseVoltage * (1 + getRandom(-config.voltageFluctuationPercent / 100, config.voltageFluctuationPercent / 100));
// Determine status based on load vs capacity
const loadRatio = node.capacity ? state.load / node.capacity : 0;
if (loadRatio >= 1.0) {
state.status = 'overload';
overloadCount++;
} else if (loadRatio >= 0.8) {
state.status = 'high';
highLoadCount++;
} else if (loadRatio <= 0.3) {
state.status = 'low';
} else {
state.status = 'normal';
}
if (node.type === 'feeder') { // Only feeders contribute directly to total load in this model
totalLoad += state.load;
}
activeNodes++;
// Generate simple forecast
state.forecast = generateSimpleForecast(node, time, config.forecastHorizonHours);
});
gridState.totalLoad = totalLoad;
gridState.stabilityIndex = calculateStabilityIndex(overloadCount, highLoadCount, activeNodes);
gridState.predictedPeak = calculatePredictedPeak(config.forecastHorizonHours);
// Generate Alerts based on current state and forecast
generateAlerts(time);
}
function generateSimpleForecast(node, startTime, hours) {
const forecast = [];
if (node.type !== 'feeder' || !node.baseLoad) {
// Simplified: Substations forecast is sum of feeder forecasts
// For now, return empty forecast for non-feeders/nodes without baseLoad
if (node.type === 'substation') {
const connectedFeeders = config.grid.connections
.filter(c => c.from === node.id && gridState[c.to]?.config?.type === 'feeder')
.map(c => c.to);
if (connectedFeeders.length > 0) {
for (let i = 1; i <= hours; i++) {
const forecastTime = dayjs(startTime).add(i, 'hour');
let subForecastLoad = 0;
connectedFeeders.forEach(feederId => {
const feederNode = gridState[feederId].config;
const feederForecast = generateSimpleForecast(feederNode, startTime, hours);
subForecastLoad += feederForecast[i-1]?.load || 0;
});
forecast.push({ time: forecastTime.toDate(), load: subForecastLoad });
}
return forecast;
}
}
return [];
}
for (let i = 1; i <= hours; i++) {
const forecastTime = dayjs(startTime).add(i, 'hour');
const hour = forecastTime.hour();
const day = forecastTime.day();
const weekend = (day === 0 || day === 6);
let forecastLoad = node.baseLoad[hour] * (weekend ? node.weekendMultiplier : 1);
// Add some basic trend/randomness if needed, keeping it simple here
forecastLoad *= (1 + getRandom(-config.loadFluctuationPercent / 150, config.loadFluctuationPercent / 150)); // Less fluctuation in forecast
forecast.push({ time: forecastTime.toDate(), load: Math.max(0, forecastLoad) });
}
return forecast;
}
function calculatePredictedPeak(hours) {
let peakLoad = 0;
let peakTime = null;
const forecastEndTime = dayjs(currentTime).add(hours, 'hour');
// Aggregate forecasts across all feeders
let aggregatedForecast = Array(hours).fill(0);
config.grid.nodes.forEach(node => {
if (gridState[node.id]?.forecast?.length === hours) {
gridState[node.id].forecast.forEach((f, index) => {
if (node.type === 'feeder') { // Only sum feeder forecasts for total peak
aggregatedForecast[index] += f.load;
}
});
}
});
aggregatedForecast.forEach((load, index) => {
if (load > peakLoad) {
peakLoad = load;
peakTime = dayjs(currentTime).add(index + 1, 'hour');
}
});
return { load: peakLoad, time: peakTime };
}
function calculateStabilityIndex(overloadCount, highLoadCount, activeNodes) {
// Very simple conceptual index 0-100
let score = 100;
score -= overloadCount * 30; // Heavy penalty for overloads
score -= highLoadCount * 10; // Medium penalty for high load
if (activeNodes < config.grid.nodes.length * 0.8) score -= 20; // Penalty for offline nodes
return Math.max(0, Math.min(100, Math.round(score)));
}
// --- UI Update ---
function updateUI() {
currentDateTimeInput.value = formatLocalDateTimeForInput(currentTime);
simulationTimeSpan.textContent = formatDateTime(currentTime);
simulationStatusSpan.textContent = simulationRunning ? '运行中' : '已暂停';
currentTotalLoadSpan.textContent = `${gridState.totalLoad?.toFixed(1) ?? '--'} MW`;
predictedPeakLoadSpan.textContent = `${gridState.predictedPeak?.load.toFixed(1) ?? '--'} MW`;
gridStabilityIndexSpan.textContent = gridState.stabilityIndex ?? '--';
updateTopologyStyles();
updateNodeDetailsPanel(); // Update panel if a node is selected
updateLoadForecastChart(); // Update chart
}
function updateTopologyStyles() {
config.grid.nodes.forEach(node => {
const el = nodeElements[node.id];
const state = gridState[node.id];
if (el && state) {
// Remove old status classes
el.classList.remove('low', 'normal', 'high', 'overload', 'offline');
// Add current status class
el.classList.add(state.status);
}
});
config.grid.connections.forEach(conn => {
const lineEl = lineElements[`line-${conn.from}-${conn.to}`];
const fromState = gridState[conn.from];
const toState = gridState[conn.to];
if (lineEl && fromState && toState) {
lineEl.classList.remove('low', 'normal', 'high', 'overload', 'offline');
// Line color based on the node it feeds (the 'to' node), or 'from' if 'to' is offline
const statusToUse = (toState.status !== 'offline') ? toState.status : fromState.status;
lineEl.classList.add(statusToUse);
if (fromState.status === 'offline' || toState.status === 'offline') {
lineEl.classList.add('offline'); // If either end is offline, line is offline
}
}
});
}
function updateNodeDetailsPanel() {
if (!selectedNodeId || !gridState[selectedNodeId]) {
selectedNodeNameSpan.textContent = '未选择';
nodeDetailsDiv.innerHTML = '<p>请在左侧拓扑图中选择一个节点查看详细数据。</p>';
return;
}
const state = gridState[selectedNodeId];
const nodeConfig = state.config;
selectedNodeNameSpan.textContent = nodeConfig.name;
let detailsHTML = `
<p><strong>ID:</strong> <span>${nodeConfig.id}</span></p>
<p><strong>类型:</strong> <span>${nodeConfig.type === 'substation' ? '变电站' : '馈线'}</span></p>
<p><strong>当前负载:</strong> <span class="status-${state.status}">${state.load.toFixed(1)} MW</span></p>
<p><strong>${nodeConfig.type === 'substation' ? '额定电压:' : '馈线电压:'}</strong> <span>${state.voltage.toFixed(1)} kV</span></p>
${nodeConfig.capacity ? `<p><strong>容量:</strong> <span>${nodeConfig.capacity} MW</span></p>` : ''}
<p><strong>状态:</strong> <span class="status-${state.status}">${getStatusText(state.status)}</span></p>
`;
// Add predicted peak for this specific node if available
if (state.forecast && state.forecast.length > 0) {
const nodePeak = state.forecast.reduce((max, p) => p.load > max.load ? p : max, { load: 0 });
if (nodePeak.load > 0) {
detailsHTML += `<p><strong>预测峰值 (节点, 24h):</strong> <span>${nodePeak.load.toFixed(1)} MW at ${dayjs(nodePeak.time).format('HH:mm')}</span></p>`;
}
}
nodeDetailsDiv.innerHTML = detailsHTML;
}
// *** MODIFIED function to show total load or selected node load ***
function updateLoadForecastChart() {
if (!loadForecastChart) return; // Chart not initialized
let historicalData = [];
let forecastData = [];
let chartLabelSuffix = "";
if (!selectedNodeId) {
// No node selected - Show aggregated data for all feeders
chartLabelSuffix = " (总计)";
const allHistorical = [];
const allForecast = [];
config.grid.nodes.forEach(node => {
if (node.type === 'feeder') {
allHistorical.push(getHistoricalData(node.id, config.historicalHours));
allForecast.push(gridState[node.id]?.forecast || []);
}
});
historicalData = aggregateDataPoints(allHistorical);
forecastData = aggregateDataPoints(allForecast);
} else if (gridState[selectedNodeId]) {
// Node selected - Show its specific data
const state = gridState[selectedNodeId];
chartLabelSuffix = ` (${state.config.id})`;
historicalData = getHistoricalData(selectedNodeId, config.historicalHours);
forecastData = state.forecast || [];
} else {
// Selected node ID exists but no state found (error case?)
// Clear the chart
}
// Update chart datasets
loadForecastChart.data.datasets[0].data = historicalData.map(p => ({ x: p.time, y: p.load }));
loadForecastChart.data.datasets[0].label = `历史负载 (MW)${chartLabelSuffix}`;
loadForecastChart.data.datasets[1].data = forecastData.map(p => ({ x: p.time, y: p.load }));
loadForecastChart.data.datasets[1].label = `预测负载 (MW)${chartLabelSuffix}`;
// Adjust time axis only if there is data
if (historicalData.length > 0 || forecastData.length > 0) {
const firstTime = historicalData[0]?.time ?? forecastData[0]?.time;
const lastTime = forecastData[forecastData.length - 1]?.time ?? historicalData[historicalData.length - 1]?.time;
if (firstTime && lastTime) {
loadForecastChart.options.scales.x.min = dayjs(firstTime).subtract(30, 'minute').toDate();
loadForecastChart.options.scales.x.max = dayjs(lastTime).add(30, 'minute').toDate();
} else {
// Reset axes if no valid time data
loadForecastChart.options.scales.x.min = null;
loadForecastChart.options.scales.x.max = null;
}
} else {
// Reset axes if no data at all
loadForecastChart.options.scales.x.min = null;
loadForecastChart.options.scales.x.max = null;
}
loadForecastChart.update('none'); // Use 'none' to avoid potentially jerky updates when switching nodes
}
function getHistoricalData(nodeId, hoursBack) {
// This is simplified - in a real app, this data would come from a backend/database
// Here, we just simulate it by recalculating past loads based on the pattern
const history = [];
const node = gridState[nodeId].config;
if (node.type !== 'feeder' || !node.baseLoad) return []; // Only feeders have direct history in this model
for (let i = hoursBack; i > 0; i--) {
const pastTime = dayjs(currentTime).subtract(i, 'hour');
const hour = pastTime.hour();
const day = pastTime.day();
const weekend = (day === 0 || day === 6);
let pastLoad = node.baseLoad[hour] * (weekend ? node.weekendMultiplier : 1);
pastLoad *= (1 + getRandom(-config.loadFluctuationPercent / 100, config.loadFluctuationPercent / 100)); // Simulate past fluctuation
history.push({ time: pastTime.toDate(), load: Math.max(0, pastLoad) });
}
// Add current point
history.push({ time: currentTime.toDate(), load: gridState[nodeId].load });
return history;
}
function getStatusText(status) {
switch (status) {
case 'low': return '低负载';
case 'normal': return '正常';
case 'high': return '高负载';
case 'overload': return '过载';
case 'offline': return '离线';
default: return '未知';
}
}
function addLog(message, type = 'info') {
const li = document.createElement('li');
li.classList.add(`alert-${type}`);
li.textContent = `[${formatDateTime(currentTime)}] ${message}`;
alertListUl.insertBefore(li, alertListUl.firstChild);
if (alertListUl.children.length > 20) { // Limit log size
alertListUl.removeChild(alertListUl.lastChild);
}
}
function generateAlerts(time) {
// Check for current overloads
config.grid.nodes.forEach(node => {
const state = gridState[node.id];
if (state.status === 'overload') {
addLog(`严重警告: 节点 ${node.name} (${node.id}) 当前已过载! 负载: ${state.load.toFixed(1)} MW / ${node.capacity} MW`, 'critical');
}
});
// Check for predicted overloads (within next few hours)
const predictionHorizonAlert = 6; // Check for overloads in next 6 hours
config.grid.nodes.forEach(node => {
const state = gridState[node.id];
if (state.forecast && node.capacity) {
for(let i=0; i < predictionHorizonAlert && i < state.forecast.length; i++) {
const forecastPoint = state.forecast[i];
if (forecastPoint.load > node.capacity) {
addLog(`预警: 节点 ${node.name} (${node.id}) 预计在 ${dayjs(forecastPoint.time).format('HH:mm')} 过载 (预测 ${forecastPoint.load.toFixed(1)} MW)`, 'warning');
break; // Only log first predicted overload for this node
}
}
}
});
// Stability suggestion
if (gridState.stabilityIndex < 60) {
addLog(`建议: 电网稳定性 (${gridState.stabilityIndex}) 偏低,请关注高负载和过载节点。`, 'suggestion');
}
}
// --- Event Handlers ---
function handleNodeClick(nodeId) {
if (selectedNodeId === nodeId) {
selectedNodeId = null; // Deselect if clicked again
nodeElements[nodeId]?.classList.remove('selected');
} else {
if (selectedNodeId && nodeElements[selectedNodeId]) {
nodeElements[selectedNodeId].classList.remove('selected');
}
selectedNodeId = nodeId;
if (nodeElements[selectedNodeId]) {
nodeElements[selectedNodeId].classList.add('selected');
// Optional: remove highlight after some time
setTimeout(() => {
nodeElements[selectedNodeId]?.classList.remove('selected');
if(selectedNodeId === nodeId) { /* Check if still selected */ } // Keep selected logically
}, config.nodeClickHighlightDuration);
}
}
updateNodeDetailsPanel();
updateLoadForecastChart(); // Update chart for the selected/deselected node
}
playPauseBtn.addEventListener('click', () => {
simulationRunning = !simulationRunning;
playPauseBtn.textContent = simulationRunning ? '⏸️' : '▶️';
simulationStatusSpan.textContent = simulationRunning ? '运行中' : '已暂停';
if (simulationRunning) {
clearTimeout(simulationTimer);
simulationStep(); // Start the loop immediately
addLog("模拟已开始", 'info');
} else {
clearTimeout(simulationTimer);
addLog("模拟已暂停", 'info');
}
});
timeSpeedSelect.addEventListener('change', (e) => {
simulationSpeed = parseInt(e.target.value, 10);
addLog(`模拟速度设置为 ${simulationSpeed}x`, 'info');
});
resetTimeBtn.addEventListener('click', () => {
simulationRunning = false;
clearTimeout(simulationTimer);
currentTime = dayjs(config.startTime);
playPauseBtn.textContent = '▶️';
initializeGridState();
selectedNodeId = null; // Deselect node
updateGridState(currentTime); // Recalculate initial state
updateUI();
// *** Modify Reset: Clear chart data instead of re-initializing ***
if (loadForecastChart) {
loadForecastChart.data.datasets[0].data = [];
loadForecastChart.data.datasets[1].data = [];
// Update chart labels to default (total load)
loadForecastChart.data.datasets[0].label = '历史负载 (MW) (总计)';
loadForecastChart.data.datasets[1].label = '预测负载 (MW) (总计)';
// Recalculate aggregated data for the reset time and update
const allHistorical = [];
const allForecast = [];
config.grid.nodes.forEach(node => {
if (node.type === 'feeder') {
allHistorical.push(getHistoricalData(node.id, config.historicalHours));
allForecast.push(gridState[node.id]?.forecast || []);
}
});
const historicalData = aggregateDataPoints(allHistorical);
const forecastData = aggregateDataPoints(allForecast);
loadForecastChart.data.datasets[0].data = historicalData.map(p => ({ x: p.time, y: p.load }));
loadForecastChart.data.datasets[1].data = forecastData.map(p => ({ x: p.time, y: p.load }));
// Reset axes
loadForecastChart.options.scales.x.min = null;
loadForecastChart.options.scales.x.max = null;
loadForecastChart.update('none'); // Update immediately without animation
} else {
// If chart wasn't initialized somehow, initialize it now
initializeChart();
}
// *** End chart modification for reset ***
alertListUl.innerHTML = '<li>系统已重置</li>'; // Clear logs
addLog("模拟已重置到初始时间", 'info');
// updateLoadForecastChart(); // No longer needed here, handled above
});
// Resize handler for topology redraw
let resizeTimeout;
window.addEventListener('resize', () => {
clearTimeout(resizeTimeout);
resizeTimeout = setTimeout(() => {
drawGridTopology(); // Redraw topology
updateTopologyStyles(); // Reapply styles
if(loadForecastChart) { // Trigger chart redraw
loadForecastChart.resize();
}
}, 250);
});
// --- Initial Setup ---
function initializeApp() {
initializeGridState();
drawGridTopology();
initializeChart();
updateGridState(currentTime); // Calculate initial state before first draw
updateUI();
addLog("电网分析组件初始化完成", 'info');
}
initializeApp();
});