Title
题目
MERIT: Multi-view evidential learning for reliable and interpretable liverfibrosis staging✩
MERIT:用于可靠且可解释的肝纤维化分期的多视图证据学习✩
01
文献速递介绍
肝纤维化源于细胞外基质蛋白(尤其是胶原蛋白)的过度积累,可能进展为肝硬化甚至肝癌(Li et al., 2022a)。Scheuer系统是评估肝纤维化分期的常用标准,将其分为四个不同阶段(S1-S4),其中S1表示纤维门脉扩张,S4代表严重肝硬化(Scheuer, 1991)。准确评估纤维化严重程度对各类慢性肝病的诊断和治疗规划至关重要。既往研究已发现特定的MRI特征可辅助检测肝纤维化,使用Gd-EOB-DTPA对比剂可进一步提升评估效果(Pickhardt et al., 2019; Li et al., 2022b)。 近年来,基于深度学习的方法已成为医学图像分析的强大框架(Litjens et al., 2017; Sharma et al., 2021)。针对肝纤维化分期,研究者提出了多种方法,包括卷积神经网络(CNNs)(Yasaka et al., 2018b; Li et al., 2020)、对比学习(Huang et al., 2019)、迁移学习(Xue et al., 2020; Nowak et al., 2021)和高级生成对抗网络(GAN)(Duan et al., 2022)。然而,这些方法通常将整个肝脏扫描图像作为模型训练的输入,由于肝脏形状不规则且腹部图像中存在无关解剖结构,可能导致特征提取不充分。此外,肝纤维化的征象(如表面结节变化、肝裂增宽、左右肝叶比例失衡)分布于全肝(Ito et al., 2002; Lurie et al., 2015; Ludwig et al., 2021),将整个扫描图像作为单一输入时,难以捕捉复杂的纤维化特征。近期,Hectors等人(2021)提出使用滑动窗口裁剪图像块进行数据增强,但其每次仅使用单个图像块作为输入,仅捕获肝脏的局部视图。为了利用全肝的信息性特征,我们将该任务构建为多视图学习问题,同时提取局部和全局特征。 多视图学习旨在利用多个特征的互补信息(Zhang et al., 2018; Yan et al., 2021; Han et al., 2022),其主要挑战在于如何合理整合不同视图的特征。决策级融合因能够通过系统化设计和高效流程增强大数据分析能力,并提供更优且无偏的结果而常被采用(Mangai et al., 2010; Nazari et al., 2020)。大多数决策级融合方法采用聚合策略,如简单平均(Simonyan & Zisserman, 2014; Ding et al., 2021)、多数投票(Kuncheva & Rodríguez, 2014; Aeeneh et al., 2024)或可学习模型(Wang et al., 2019; Xia & Zhang, 2022)。然而,这些方法中多视图特征的权重通常是固定的(限制了模型灵活性)或通过模型训练隐式学习(损害了决策过程的可解释性)。更重要的是,这些方法无法量化不确定性,而不确定性量化对于医疗应用中的模型可信度至关重要。 为提升多视图学习的可靠性,既往方法主要通过蒙特卡洛(MC) dropout(Gal & Ghahramani, 2016)、变分推理(VI)(Subedar et al., 2019)或集成学习(Durasov et al., 2021)来建模模型不确定性(也称认知不确定性)(Kendall & Gal, 2017)。但此类模型未能显式捕捉因测试数据与训练数据分布不匹配导致的不确定性。PriorNet(Malinin & Gales, 2018)首次通过为分类模型赋予先验狄利克雷分布引入分布不确定性,使其能够检测分布外(OOD)样本。证据学习(Sensoy et al., 2018; Zheng & Yu, 2023; Chen et al., 2024)在证据理论(Dempster, 1968)框架下提供了另一种建模分布不确定性的方法,将神经网络输出表示为“观点”(opinion),通过狄利克雷分布量化分布不确定性。然而,上述方法主要关注特征分布偏移引起的不确定性,忽略了类别分布偏移的影响。如图1(a)所示,肝纤维化分期任务中可能同时存在特征和类别分布偏移,导致模型预测不可靠。 基于证据学习,本研究提出MERIT,一种用于肝纤维化分期的证据多视图学习框架。如图1(b)所示,该框架基于主观逻辑理论(Jøsang, 2016)将神经网络输出表示为“观点”,以增强分布偏移场景下的可靠性;同时,采用特征特异性信念融合算子集成多源观点,实现基于模型的即席(ad-hoc)可解释性和事后(post-hoc)可解释性(Murdoch et al., 2019)。即席可解释性源于模型的模块化设计——基于“观点”的决策过程具有可解释性,而黑箱神经网络仅作为支持“观点”表示的工具;事后可解释性则通过训练后的模型提供预测层面的解释,每个特征分量(即肝脏的子视图)的贡献可通过不确定性量化。 本研究是我们在MICCAI 2023会议论文(Gao et al., 2023)基础上的扩展,此前研究已提出一种具有可解释融合策略的不确定性感知多视图学习方法用于肝纤维化分期。相较于前期工作,本文的新贡献如下: • 在证据深度学习中引入类别分布感知先验率(base rate),以解决类别分布偏移问题; • 通过引入特征特异性融合算子改进组合规则,忠实建模局部与全局视图特征的关系,并提供其在本任务中的适用性理论分析以阐释可解释性; • 在扩展的多中心肝脏MRI数据集上开展广泛实验,包括特征和类别分布偏移场景下的可靠性评估,以及用于事后可解释性的特征消融研究。 全文结构如下:第2节讨论相关研究;第3节阐述所提出的MERIT肝纤维化分期框架;第4节介绍实验设置及方法在可靠性、可解释性和多视图建模方面的评估结果;第6节总结研究。
Abatract
摘要
Accurate staging of liver fibrosis from magnetic resonance imaging (MRI) is crucial in clinical practice. Whileconventional methods often focus on a specific sub-region, multi-view learning captures more informationby analyzing multiple patches simultaneously. However, previous multi-view approaches could not typicallycalculate uncertainty by nature, and they generally integrate features from different views in a black-boxfashion, hence compromising reliability as well as interpretability of the resulting models. In this work, wepropose a new multi-view method based on evidential learning, referred to as MERIT, which tackles the twochallenges in a unified framework. MERIT enables uncertainty quantification of the predictions to enhancereliability, and employs a logic-based combination rule to improve interpretability. Specifically, MERIT modelsthe prediction from each sub-view as an opinion with quantified uncertainty under the guidance of thesubjective logic theory. Furthermore, a distribution-aware base rate is introduced to enhance performance,particularly in scenarios involving class distribution shifts. Finally, MERIT adopts a feature-specific combinationrule to explicitly fuse multi-view predictions, thereby enhancing interpretability. Results have showcasedthe effectiveness of the proposed MERIT, highlighting the reliability and offering both ad-hoc and posthoc interpretability. They also illustrate that MERIT can elucidate the significance of each view in thedecision-making process for liver fibrosis staging.
从磁共振成像(MRI)中准确进行肝纤维化分期在临床实践中至关重要。传统方法通常聚焦于特定子区域,而多视图学习通过同时分析多个图像块来捕获更多信息。然而,以往的多视图方法通常无法本质上计算不确定性,且普遍以黑箱方式集成不同视图的特征,从而损害了所得模型的可靠性和可解释性。在这项工作中,我们提出了一种基于证据学习的新型多视图方法——MERIT,该方法在统一框架中解决了这两个挑战。MERIT能够对预测结果进行不确定性量化以增强可靠性,并采用基于逻辑的组合规则来提高可解释性。 具体而言,MERIT在主观逻辑理论的指导下,将每个子视图的预测建模为具有量化不确定性的“观点”(opinion)。此外,引入了一种分布感知先验率(distribution-aware base rate)以提升性能,尤其是在涉及类别分布偏移的场景中。最后,MERIT采用特定于特征的组合规则来显式融合多视图预测,从而增强可解释性。实验结果展示了所提出的MERIT的有效性,突出了其可靠性,并提供了即席(ad-hoc)和事后(post-hoc)可解释性。结果还表明,MERIT能够阐明每个视图在肝纤维化分期决策过程中的重要性。
Method
方法
This work is aimed at building a distributional uncertainty-awareclassification model for liver fibrosis staging, which takes multiplepatches of the liver MRI as input and predicts the staging resultswith quantified uncertainty. Based on the subjective logic theory, ourmethod represents the predictions of each view as opinions and incorporates logic-based combination rules to enhance the interpretability.
本研究旨在构建一种适用于肝纤维化分期的分布不确定性感知分类模型,该模型以肝脏MRI的多个图像块作为输入,并通过量化不确定性对分期结果进行预测。基于主观逻辑理论,我们的方法将每个视图的预测结果表示为“观点”,并引入基于逻辑的组合规则以增强模型的可解释性。
Conclusion
结论
In this work, we propose a reliable and interpretable multi-viewlearning framework for liver fibrosis staging (MERIT) based on evidential theory. Specifically, we model the liver fibrosis staging as amulti-view learning task, with cropped local image patches and a globalview. Then we employ the subjective logic theory to estimate thedistributional uncertainty of prediction in each view. Furthermore, weutilize a feature-specific combination rule to fuse the predictions explicitly. Additionally, we incorporate a class distribution-aware base rateto tackle the distribution shift problem. Quantitative and qualitativeexperimental results on reliability and multi-view modeling, as well asthe ad-hoc and post-hoc interpretability, have shown the effectivenessof the proposed MERIT.
在这项工作中,我们提出了一种基于证据理论的可靠且可解释的肝纤维化分期多视图学习框架(MERIT)。具体而言,我们将肝纤维化分期建模为多视图学习任务,包含裁剪的局部图像块和全局视图。随后,利用主观逻辑理论估计每个视图预测的分布不确定性,并采用特征特异性组合规则显式融合预测结果。此外,引入类别分布感知先验率以解决分布偏移问题。关于可靠性、多视图建模以及即席和事后可解释性的定量与定性实验结果,均验证了所提出的MERIT框架的有效性。
Figure
图
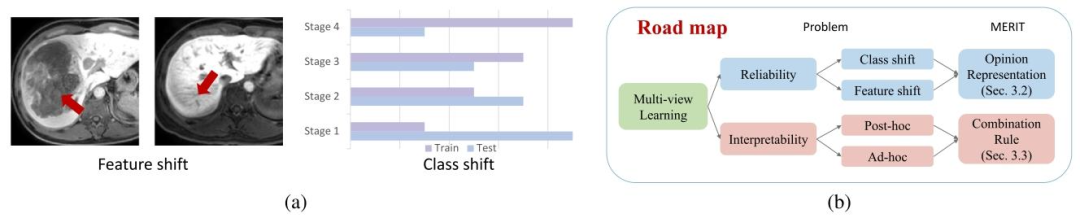
Fig. 1. (a) Distribution shift: The feature distribution shift in our problem is mainly caused by low-quality images with liver mass occupation (left) or artifacts (right). The classdistribution shift denotes the difference in class proportion between training and test data. (b) Roadmap: Our MERIT framework improves the reliability and interpretability ofmulti-view learning through opinion representation and belief fusion operators.
图1. (a) 分布偏移:本研究中特征分布偏移主要由含肝脏占位(左)或伪影(右)的低质量图像引起,类别分布偏移指训练与测试数据的类别比例差异。(b) 框架流程:我们的MERIT框架通过观点表示和信念融合算子提升多视图学习的可靠性与可解释性。
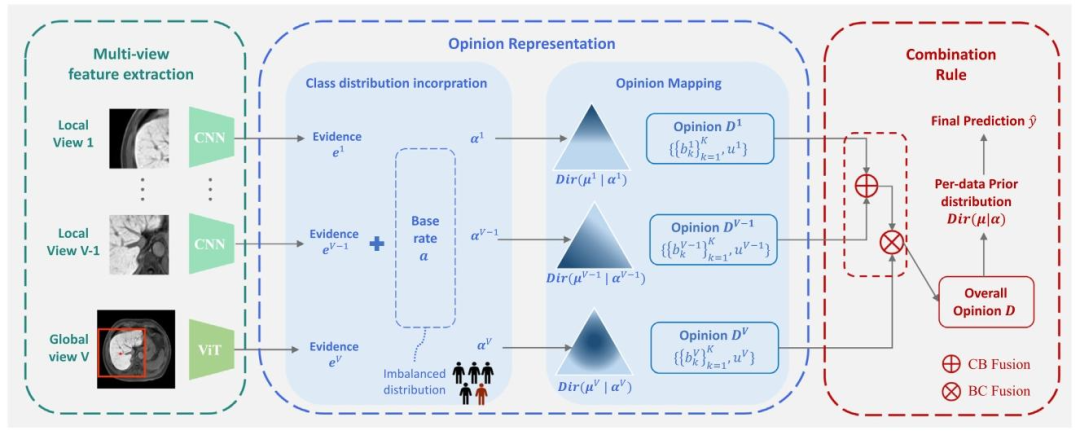
Fig. 2. The framework of MERIT consisted of multi-view feature extraction, opinion representation, and combination rule. In multi-view feature extraction, the whole liver MRIis converted to multiple local views and a global view image, which are encoded as evidence vectors {𝒆 𝑣} 𝑉 𝑣=1 by convolutional networks (CNN) and vision transformer (ViT),respectively. In opinion representation, each evidence 𝒆 𝑣 combines with the class-distribution aware base rate 𝒂 and generates a Dirichlet distribution 𝐷𝑖𝑟(𝝁 𝑣 ∣ 𝜶 𝑣 ). They can befurther represented by an opinion 𝑫 𝑣 composed of beliefs 𝑏 𝑣 𝑘 in each class and the uncertainty 𝑢 𝑣 . In combination rule, the opinions are combined via Cumulative Belief Fusion(CBF) and Belief Constraint Fusion (BCF) to derive the overall opinion 𝐷, which could be converted to the per-data prior distribution 𝐷𝑖𝑟(𝝁 ∣ 𝜶) to achieve the final prediction
图2. MERIT框架由多视图特征提取、观点表示和组合规则三部分组成。在多视图特征提取阶段,全肝脏MRI图像被转换为多个局部视图和一个全局视图图像,分别通过卷积神经网络(CNN)和视觉Transformer(ViT)编码为证据向量{𝒆<sub>𝑣</sub>}<sub>𝑣=1</sub><sup>𝑉</sup>。在观点表示阶段,每条证据𝒆<sub>𝑣</sub>与类别分布感知先验率𝒂结合,生成狄利克雷分布𝐷𝑖𝑟(𝝁<sub>𝑣</sub>∣𝜶<sub>𝑣</sub>),进一步表示为包含各分类置信度𝑏<sub>𝑣𝑘</sub>和不确定性𝑢<sub>𝑣</sub>的观点𝑫<sub>𝑣</sub>。在组合规则阶段,通过累积置信融合(CBF)和置信约束融合(BCF)对观点进行融合,推导全局观点*𝐷*,并转换为数据先验分布𝐷𝑖𝑟(𝝁∣𝜶)以实现最终预测。
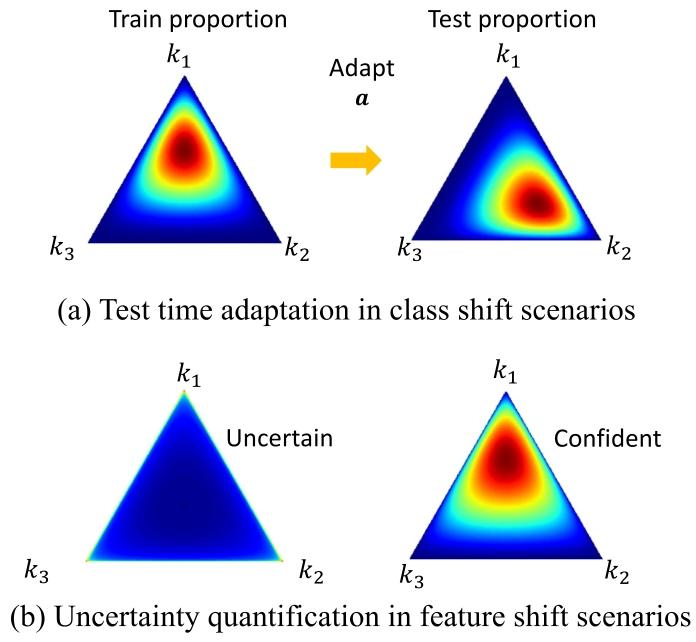
Fig. 3. The predicted Dirichlet distribution under different distribution shift scenarios.(a) The predicted Dirichlet distribution can be adapted by modifying the base ratewith the estimated test class proportion. (b) Out-of-distribution sample (left), whichcould not provide any evidence for the decision, would result in a uniform Dirichletdistribution and yield high uncertainty in our model, while the sample without featureshift (right) would produce low uncertainty
图3. 不同分布偏移场景下的预测狄利克雷分布 (a) 通过利用估计的测试类别比例调整先验率,可使预测的狄利克雷分布适配类别分布偏移。 (b) 分布外样本(左)无法为决策提供任何证据,导致模型输出均匀狄利克雷分布并产生高不确定性;而无特征偏移的样本(右)则会产生低不确定性。
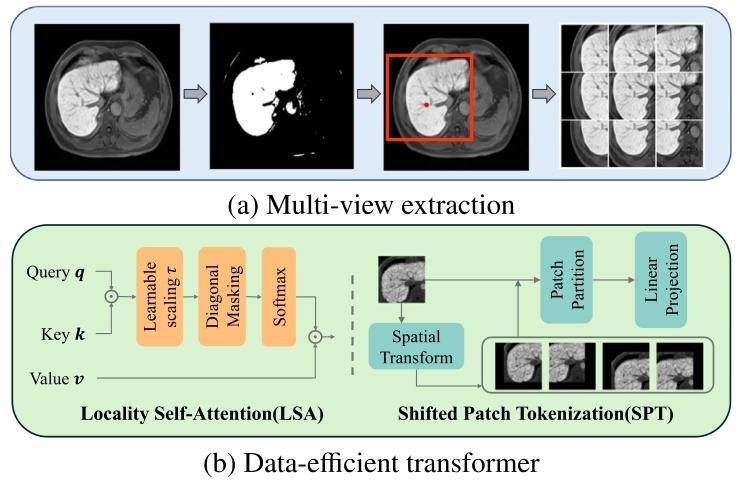
Fig. 4. (a) The pipeline to extract sub-views of the liver. First, the foreground isextracted using intensity-based segmentation. Based on the segmentation, a square ROIcentered at the centroid of the liver is cropped. Then overlapped sliding windows areused in the ROI to obtain nine sub-views of the liver. (b) Locality self-attention (LSA)and shifted patch tokenization (SPT) modules applied in the data-efficient transformer.SPT replaces the original self-attention in ViT, which introduces a learnable parameter𝜏to scale the unnormalized attention map (i.e., (𝒒𝒌 𝑇 )∕𝜏), whose diagonal elements arethen replaced with constants before softmax. LSA modifies the tokenization strategy ofViT by concatenating spatially transformed images with the original one before patchpartition.
图4. (a) 肝脏子视图提取流程。首先,使用基于强度的分割方法提取前景。在此分割结果的基础上,裁剪出以肝脏质心为中心的正方形感兴趣区域(ROI)。然后,在ROI内使用重叠滑动窗口获取肝脏的九个局部子视图。(b) 数据高效Transformer中应用的局部自注意力(LSA)和移位补丁标记化(SPT)模块。SPT模块取代了ViT中原有的自注意力机制,引入可学习参数𝜏来缩放未归一化的注意力图(即(𝒒𝒌^𝑇)/𝜏),其对角线元素在进行softmax之前会被替换为常数。LSA模块通过在补丁划分前将空间变换后的图像与原始图像拼接,修改了ViT的标记化策略。
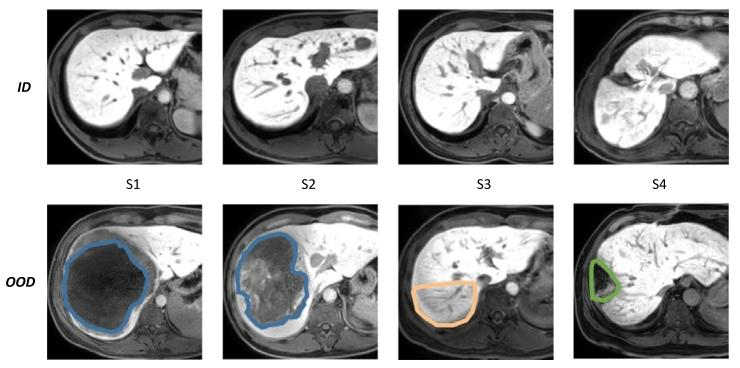
Fig. 5. MRI scans of liver tissue illustrating ID and OOD data. The top row (ID) displaysliver slices with an effective area greater than 90% denoting scans considered as normalfor the training dataset. The bottom row (OOD) depicts liver slices with an effectivearea less than 90%, representing anomalous cases used for testing the out-of-distributiondataset. Specifically, the blue area indicates liver mass, the orange area indicates localartifact and the green area indicates previous liver surgery
图5. 展示分布内(ID)和分布外(OOD)数据的肝脏组织MRI扫描图。顶行(ID)显示有效区域大于90%的肝脏切片,代表训练数据中视为正常的扫描样本;底行(OOD)描绘有效区域小于90%的肝脏切片,代表用于测试分布外数据集的异常案例。具体而言,蓝色区域表示肝脏肿块,橙色区域表示局部伪影,绿色区域表示既往肝脏手术痕迹。
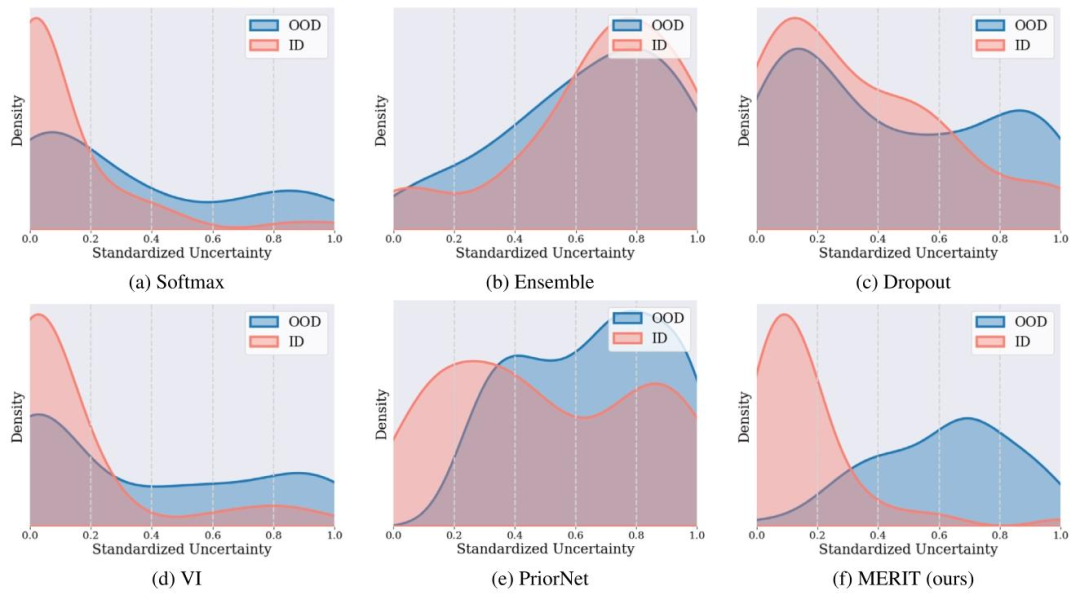
Fig. 6. Distribution of estimated uncertainty on ID and OOD Datasets by methods, including Softmax (a), Ensemble (b), Dropout (c), VI (d), PriorNet(e) and MERIT (f). MERITdemonstrated a clear distinction between the ID and OOD samples, with lower uncertainty for ID and higher uncertainty for OOD samples, which was consistent with the inherentproperties of the data
图6. 不同方法在分布内(ID)和分布外(OOD)数据集上的估计不确定性分布,包括Softmax(a)、集成学习(Ensemble,b)、Dropout(c)、变分推理(VI,d)、PriorNet(e)和MERIT(f)。MERIT显著区分了ID与OOD样本:ID样本的不确定性更低,OOD样本的不确定性更高,这与数据的内在特性一致。
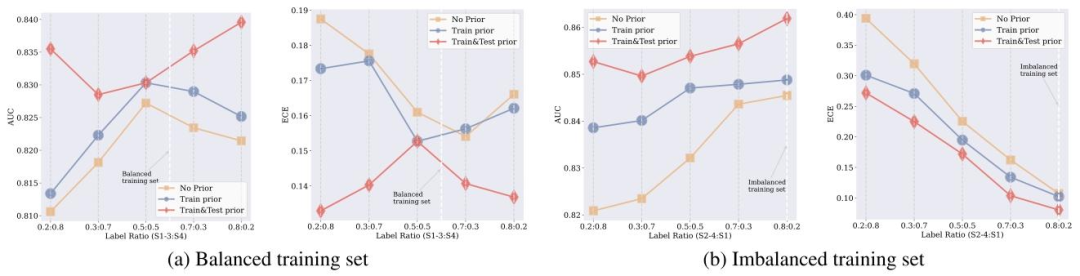
Fig. 7. Comparative analysis of AUC and ECE performance across different prior information strategies under varying class ratios. The x-axis shows the proportion of classes inthe test set, and the y-axis shows the AUC and ECE metrics, illustrating the impact of prior information on the performance and reliability of the model under different classdistributions. The lines represent the incorporation of prior class ratio information: yellow for No Prior, blue for Train Prior (introduced during training), and red for Train&TestPrior (introduced during both training and testing). In (a) Cirrhosis (S4 vs S1-3), which has balanced training data, the introduction of test prior information notably enhancesAUC performance and reduces the ECE. In (b) Substantial Fibrosis (S1 vs S2-4), characterized by imbalanced training data, the incorporation of train and test prior informationboth yield improvements over the no prior baseline.
图7. 不同类别比例下不同先验信息策略的AUC和ECE性能对比分析。x轴表示测试集中的类别比例,y轴为AUC和ECE指标,展示了不同类别分布下先验信息对模型性能和可靠性的影响。线条代表先验类别比例信息的引入方式:黄色为无先验,蓝色为训练先验(训练阶段引入),红色为训练&测试先验(训练和测试阶段均引入)。在(a)肝硬化(S4 vs S1-3)(训练数据平衡)中,测试先验信息的引入显著提升了AUC性能并降低了ECE;在(b)重度纤维化(S1 vs S2-4)(训练数据不平衡)中,引入训练和测试先验信息均比无先验基线有所改善。
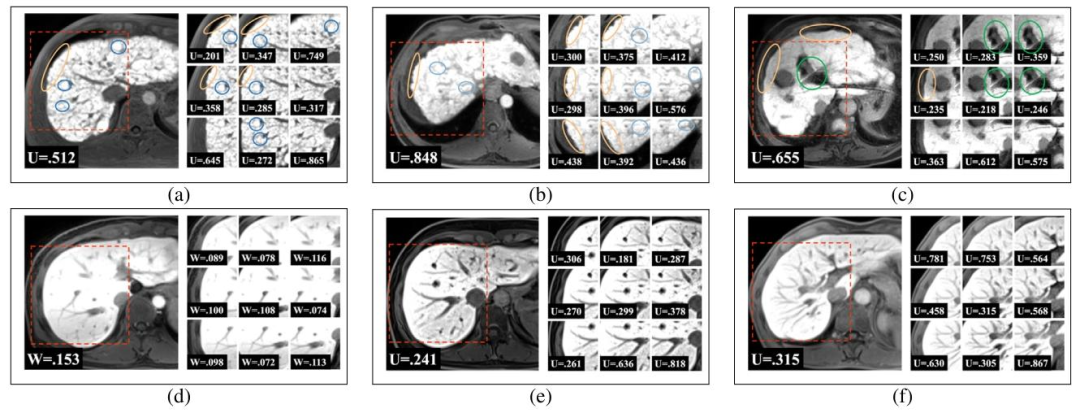
Fig. 8. Typical samples of stage 4 (a,b,c) and stage 1 (d,e,f). Visible signs of liver fibrosis are highlighted by circles. Yellow circles indicate the nodular surface contour, greencircles denote the widening of liver fissures, and blue circles denote numerous sclerotic regenerative nodules. Uncertainties (U) of local and global views estimated by our modelwere demonstrated. Notably, local views of lower uncertainty contain more signs of fibrosis. Please refer to supplementary materials for more high-resolute images.
图8. 典型的4期(a,b,c)和1期(d,e,f)样本。肝纤维化的可见特征以圆圈标记:黄色圈表示结节状表面轮廓,绿色圈表示肝裂增宽,蓝色圈表示大量硬化再生结节。图中展示了模型估计的局部和全局视图的不确定性(U)。值得注意的是,不确定性较低的局部视图通常包含更多纤维化特征。更多高分辨率图像请参见补充材料。
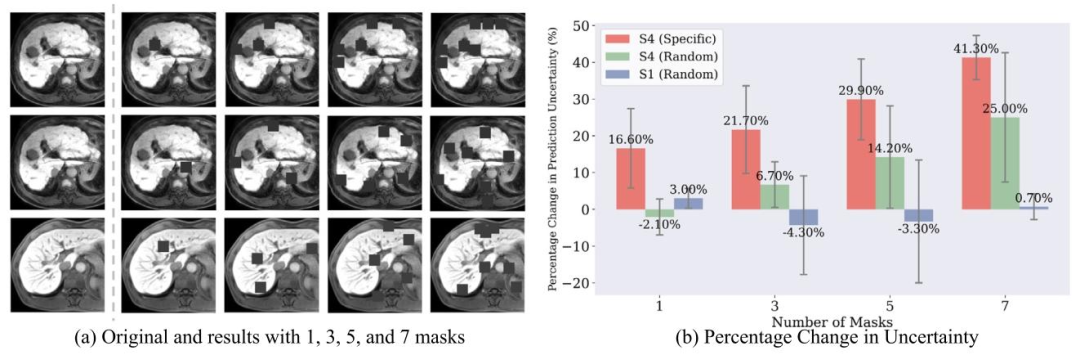
Fig. 9. Illustration of feature ablation experiments: (a) The three rows represent the S4 sample with specific masks targeting fibrosis features, the S4 sample with random masks,and the S1 sample with random masks, respectively. (b) Relative percentage changes in prediction uncertainty with varying numbers and types of masks for liver fibrosis stage 4and 1. The results demonstrated the mean percentage change and standard deviation in prediction uncertainty when 1, 3, 5, and 7 masks were applied.
图9. 特征消融实验示意图: (a) 三行分别表示针对纤维化特征的S4样本(带特定掩码)、带随机掩码的S4样本、带随机掩码的S1样本。 (b) 肝纤维化4期和1期样本在不同数量及类型掩码下,预测不确定性的相对百分比变化。结果显示了应用1、3、5、7个掩码时,预测不确定性的平均百分比变化及标准差。
Table
表
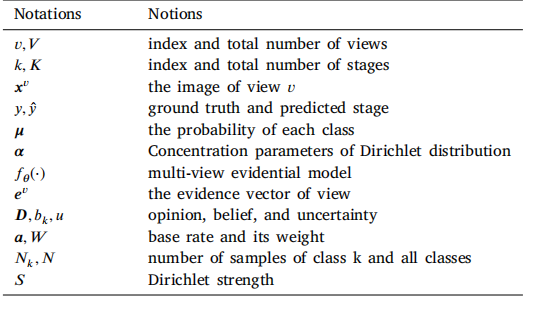
Table 1References for the mathematical symbols
表1 数学符号索引表
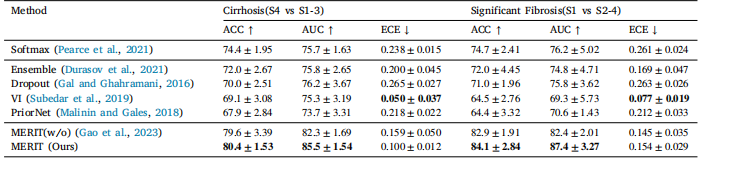
Table 2Comparison with uncertainty-aware methods. The expected calibration error (ECE) was evaluated in addition to ACC and AUC. Methods withlower ECE are more reliable
表2 与不确定性感知方法的对比。除ACC和AUC外,还评估了预期校准误差(ECE)。ECE越低的方法可靠性越高。
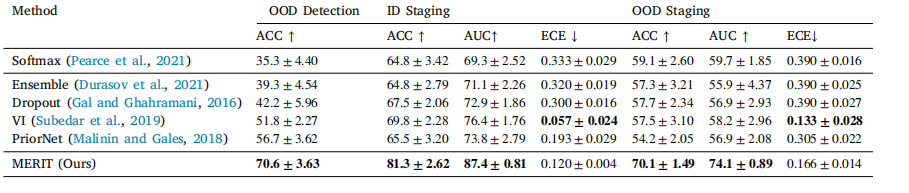
Table 3Comparison with uncertainty-aware methods, which highlights MERIT’s superior performance in both OOD detection and staging tasks,demonstrating our advanced capabilities in quantifying distributional uncertainty and achieving exceptional generalization.
表3 与不确定性感知方法的对比,结果显示MERIT在分布外(OOD)检测和分期任务中均表现出更优性能,证明了其在量化分布不确定性和实现卓越泛化能力方面的先进性。
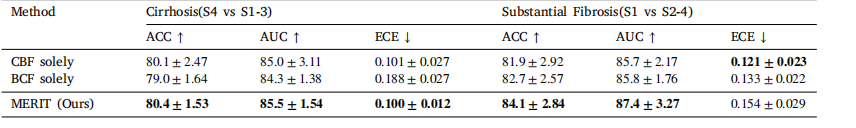
Table 4Comparison with other fusion strategies. Our feature-specific method achieved the best performance
表4 与其他融合策略的对比。我们的特征特异性方法表现最佳
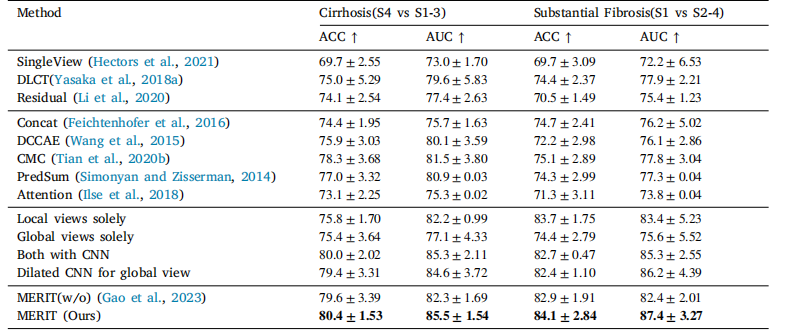
Table 5Comparison with multi-view learning methods. Results were evaluated in accuracy (ACC) and area under the receiver operatingcharacteristic curve (AUC) for both tasks.
表5 与多视图学习方法的对比。结果从准确率(ACC)和受试者工作特征曲线下面积(AUC)两个指标对两项任务进行了评估。