文章目录
Prometheus 的安装
代码中添加依赖
<!--        普罗米修斯 监控软件-->
        <dependency>
            <groupId>org.springframework.boot</groupId>
            <artifactId>spring-boot-starter-actuator</artifactId>
        </dependency>
        <dependency>
            <groupId>io.micrometer</groupId>
            <artifactId>micrometer-registry-prometheus</artifactId>
        </dependency>
还需要在 配置文件中添加一点配置:
management:
  endpoints:
    web:
      exposure:
        include: "*"  # 开放所有端点
然后就可以启动项目,访问 xxxxxxxxxxx/actuator/prometheus 这个地址了
如果看到下面这样的文字, 这一步就完成了
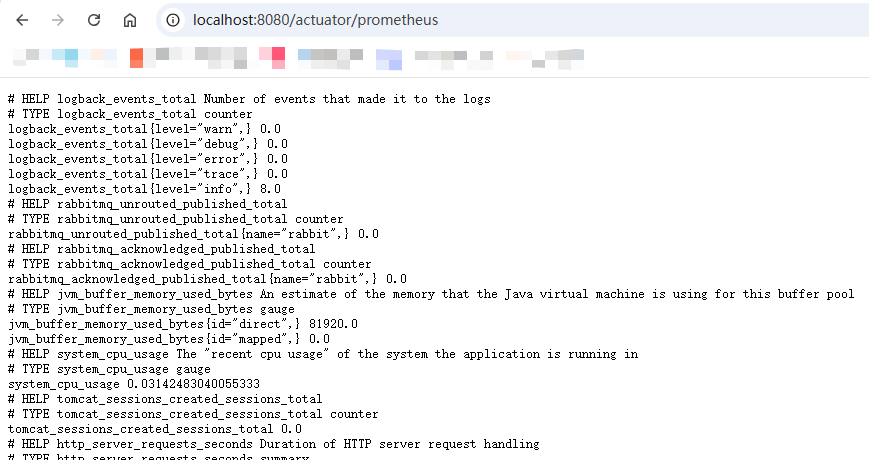
但是这里有两个问题
- 数据看不懂,很抽象,要是有个可视化的界面就好了,配上饼图等各种图最好了
- 必须手动点击刷新按钮才能看到最新的数据
所以就有了下面的 内容
下载 Prometheus zip包
官网很慢,这里我推荐使用国内的镜像
https://mirrors.tuna.tsinghua.edu.cn/github-release/prometheus/prometheus/
下载 windows amd64 的zip 包 下载之后修改一下 目录里面自带的 yml 文件
scrape_configs:
  - job_name: 'spring-boot'
    metrics_path: '/actuator/prometheus'
    static_configs:
      - targets: ['localhost:8080']
然后在文件地址栏里面输入 cmd 然后按回车并输入:
.\prometheus.exe --config.file=prometheus.yml
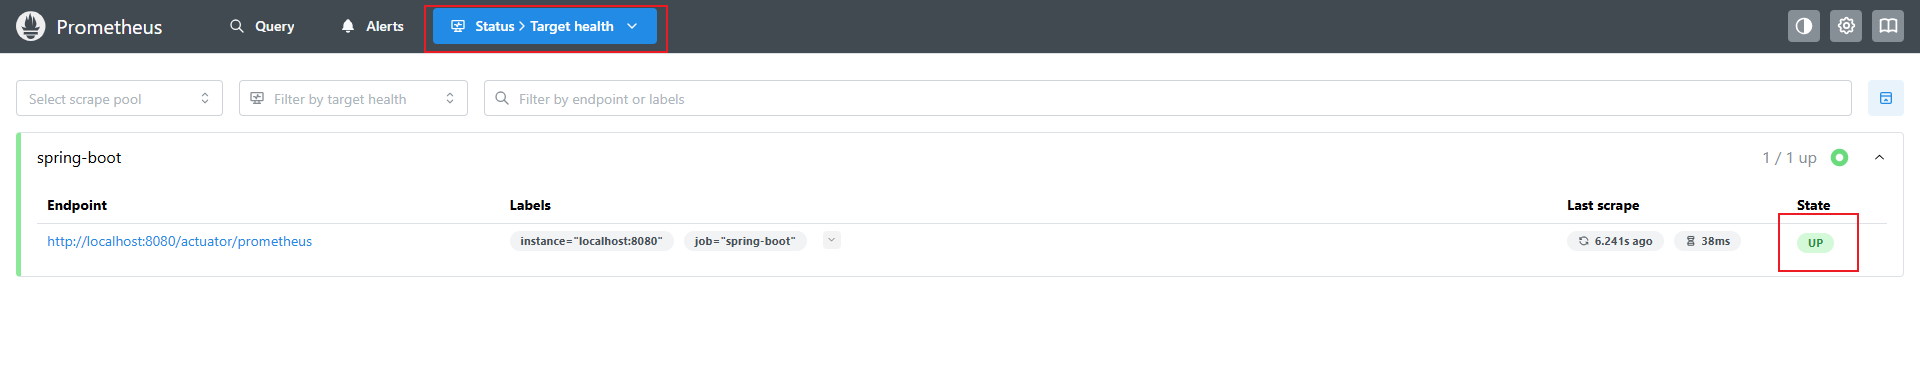
不要关控制台,接着在浏览器中访问:
http://localhost:9090/query
看到下面的展示就算成功
Grafana 的安装
- https://pan.baidu.com/s/1lBBixtqEddfwh_ARpiqHbw 提取码:p9db 获取安装包
- 解压之后 进入到 bin 目录下
- 依旧是cmd里面输入 .\grafana-server.exe
- 访问 localhost:3000端口
- 默认的账号密码是 admin /admin 如果不对,那么就执行下一步
- 重置账号密码的命令是:grafana-cli admin reset-admin-password admin (注意,此时 grafana-server 服务是没有关闭的,是一个新的 cmd 窗口执行这个命令)
- 使用 admin/admin 登录之后,会让你改密码
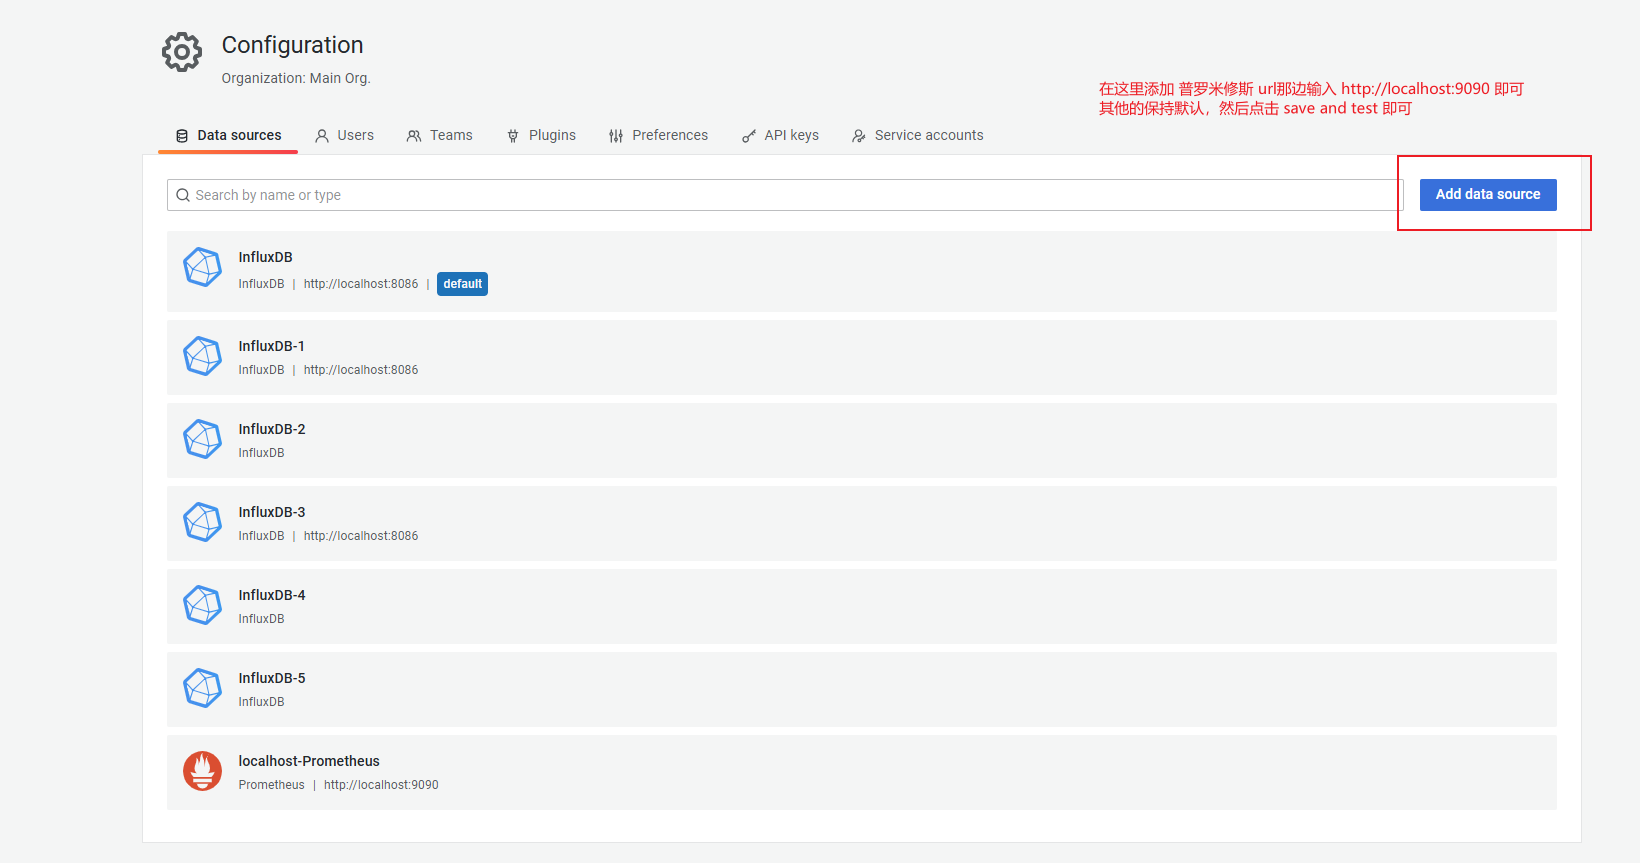
连接 普罗米修斯
在 格拉法纳 的界面找到 Data sources
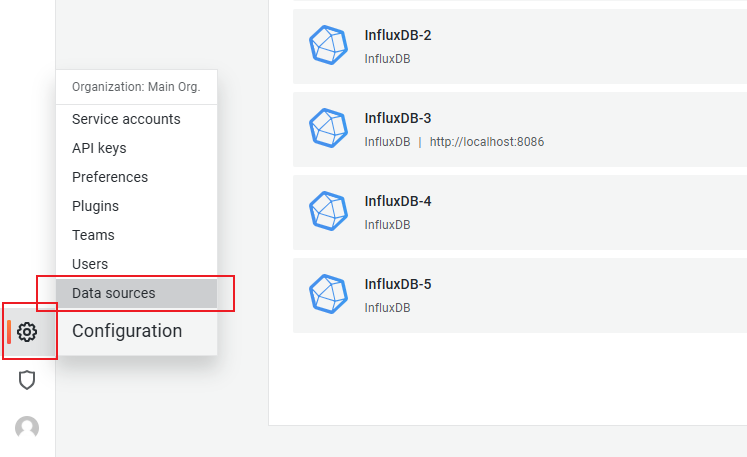
配置数据源
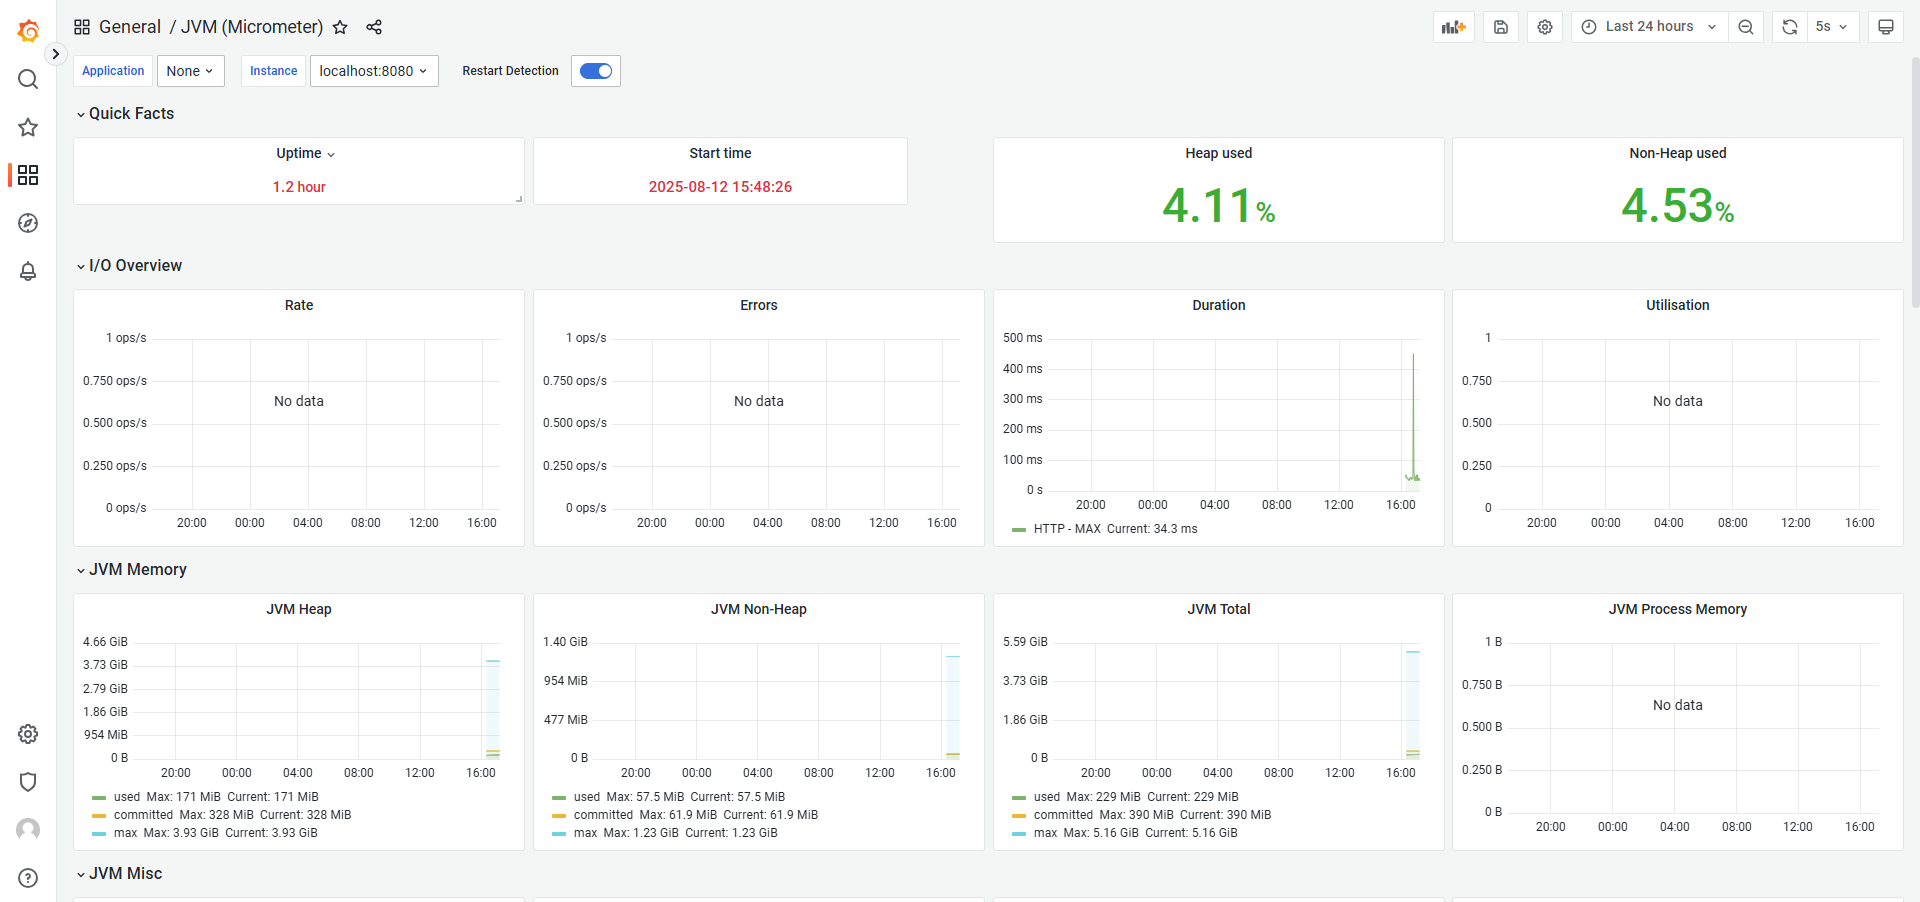
创建仪表板-1
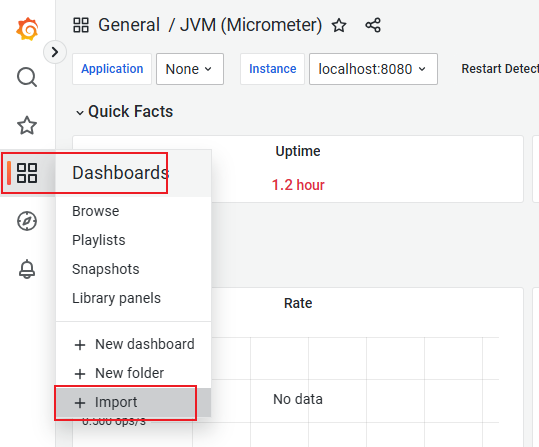
创建仪表板-2
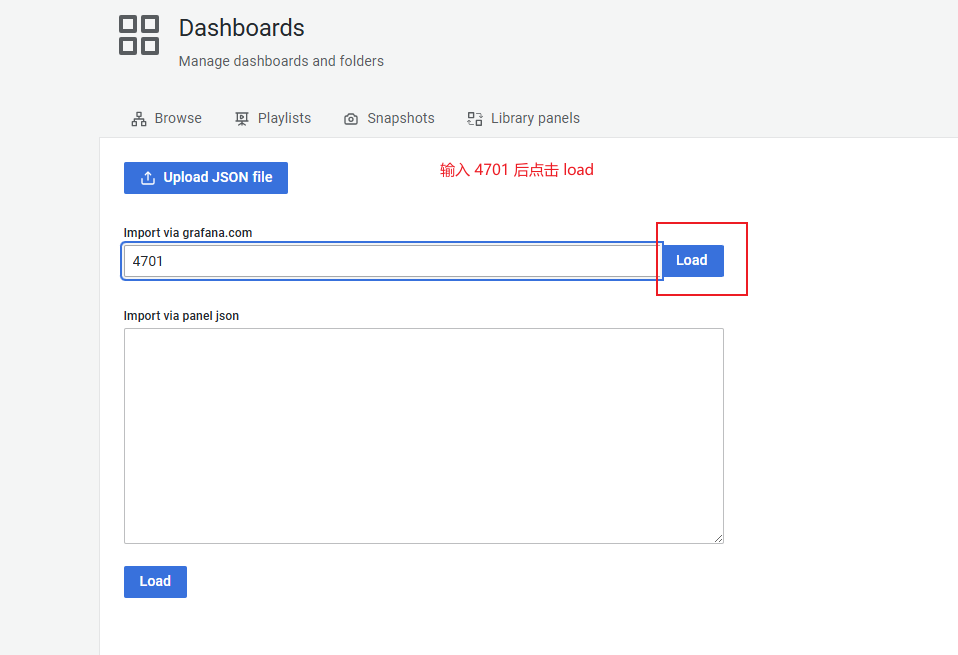
创建仪表板-3
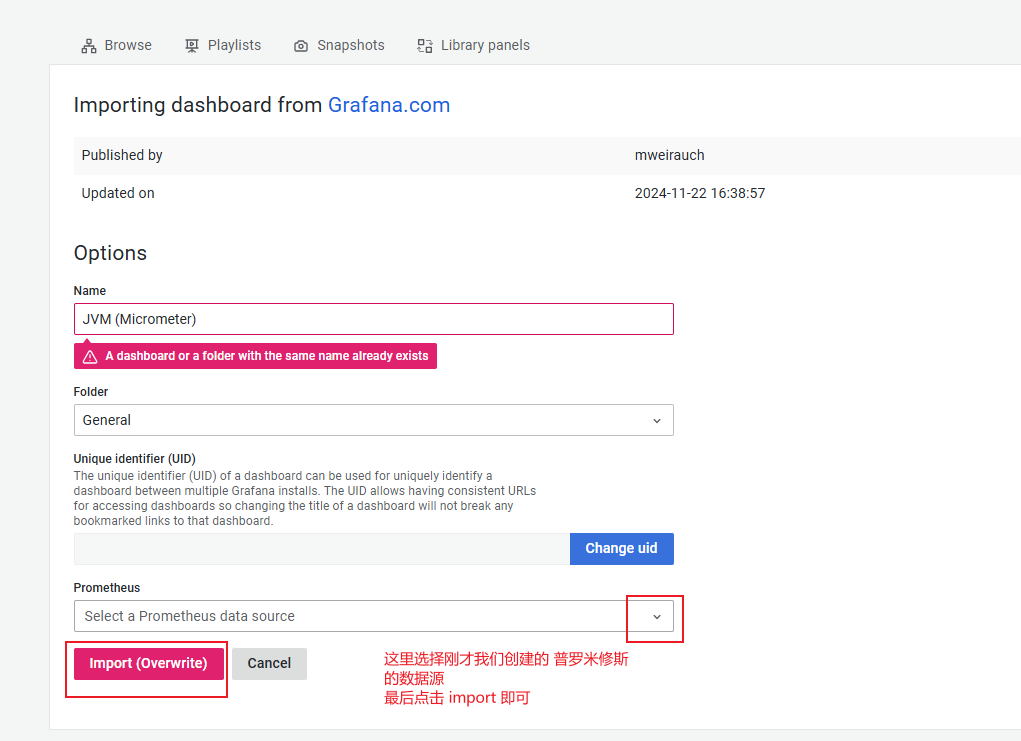
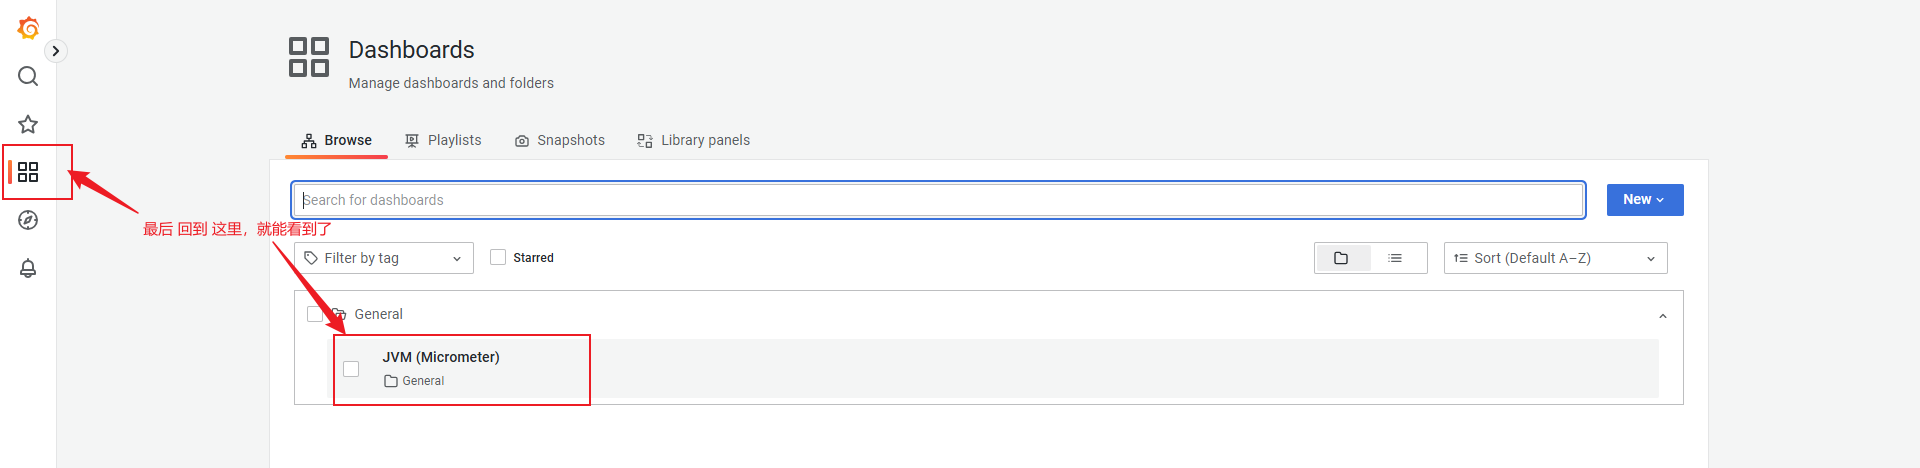
查看仪表板
结束