本文主要是python通过python_docx库来控制word的实战,可对比原文:网上原文章
原文段落:
数据分析报告
此次调研数据主要通过问卷发放的形式获取,在紫金港全校范围内开展。样本数据通过简单随机抽样和分层抽样相结合的方法,进行相对广泛的数据采集与调研,选取的样本量较大,获得的数据客观真实。以下为具体的数据分析结果:
一、总体情况
此次问卷发放情况:共发放问卷:320份
回收问卷:296份,回收率92.5%有效问卷:290份,有效率90.625%二、样本代表性;
通过最终问卷统计情况来看,此次问卷发放充分考虑到性别、专业大类以及年级的分布情况,样本分布合理,所选取的样本具有相对的典型性与代表性,可以以此为样本进行总体的推断统计以及之后的相关分析。样本具体分布情况如下:
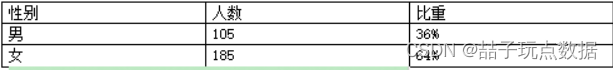
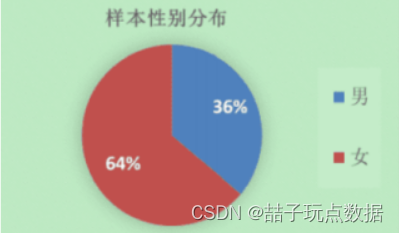
(一)性别:分布
1.导入模块
from docx import Document
from docx.shared import Pt, Cm, Inches, RGBColor
from docx.enum.text import WD_PARAGRAPH_ALIGNMENT
from docx.oxml.ns import qn
2.写入中间的大标题和两个次级标题
doc = Document()
h1 = doc.add_heading(level=1)
run = h1.add_run('数据分析报告')

h1.style.font.size = Pt(25)

h1.style.font.color.rgb = RGBColor(0, 0, 0)

h1.paragraph_format.alignment = WD_PARAGRAPH_ALIGNMENT.CENTER
h1.style.font.bold = True

run.font.name = '楷体'


p1 = doc.add_paragraph('此次调研数据主要通过问卷发放的形式获取,在紫金港全校范围内开展。样本数据通过简单随机抽样和分层抽样相结合的方法,进行相对广泛的数据采集与调研,选取的样本量较大,获得的数据客观真实。以下为具体的数据分析结果:')
p1.style.font.name = '宋体'           # 设置字体名称
r = p1.style._element.rPr.rFonts
r.set(qn('w:eastAsia'), '宋体')

h2 = doc.add_heading('一、总体情况:', level=2)
h2.style.font.color.rgb = RGBColor(0, 0, 0)
h2.style.font.size = Pt(20)

p1=doc.add_paragraph('此次问卷发放情况')

p2 = doc.add_paragraph('共发放问卷:')
run = p2.add_run('320 份')

p3 = doc.add_paragraph()
run1 = p3.add_run('回收问卷: ')
run2 = p3.add_run('296 份')
run3 = p3.add_run(',回收率')
run4 = p3.add_run('92.5%')

p4= doc.add_paragraph()
run5 = p4.add_run('有效问卷: ')
run6 = p4.add_run('290 份')
run7 = p4.add_run(',有效率')
run8 = p4.add_run('90.625%')

h3 = doc.add_heading('一、样本代表性:', level=2)
h3.style.font.color.rgb = RGBColor(0, 0, 0)
h3.style.font.size = Pt(20)

p11 = doc.add_paragraph('通过最终问卷统计情况来看,此次问卷发放充分考虑到性别、专业大类以及年级的分布情况,样本分布合理,所选取的样本具有相对的典型性与代表性,可以以此为样本进行总体的推断统计以及之后的相关分析。样本具体分布情况如下:')
p11.style.font.name = '宋体'
r = p11.style._element.rPr.rFonts
r.set(qn('w:eastAsia'), '宋体')

h4 = doc.add_heading('(一)性别:分布', level=3)
h4.style.font.color.rgb = RGBColor(0, 0, 0)
h4.style.font.size = Pt(15)
table = doc.add_table(3, 3, style="Light Grid")
table.cell(0, 0).text = '性别'
table.cell(0, 1).text = '人数'
table.cell(0, 2).text = '比重'
table.cell(1, 0).text = '男'
table.cell(2, 0).text = '女'
table.cell(1, 1).text = '105'
table.cell(1, 2).text = '36%'
table.cell(2, 1).text = '185'
table.cell(2, 2).text = '64%'
doc.add_picture('./1.png', width=Cm(10))
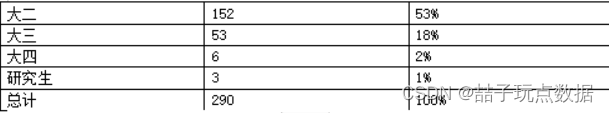
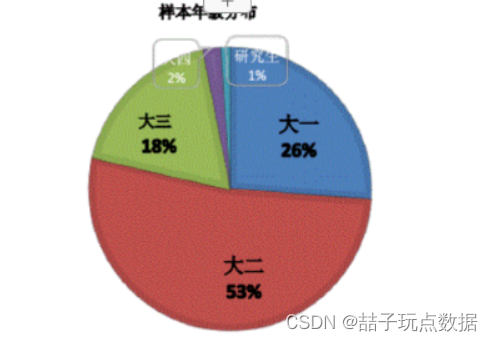
h4 = doc.add_heading('(二)年纪分布', level=3)
h4.style.font.color.rgb = RGBColor(0, 0, 0)
h4.style.font.size = Pt(15)
table = doc.add_table(7, 3, style="Light Grid")
table.cell(0, 0).text = '年级'
table.cell(0, 1).text = '人数'
table.cell(0, 2).text = '比重'
table.cell(1, 0).text = '大一'
table.cell(1, 1).text = '76'
table.cell(1, 2).text = '26%'
table.cell(2, 0).text = '大二'
table.cell(2, 1).text = '152'
table.cell(2, 2).text = '53%'
table.cell(3, 0).text = '大三'
table.cell(3, 1).text = '53'
table.cell(3, 2).text = '18%'
table.cell(4, 0).text = '大四'
table.cell(4, 1).text = '6'
table.cell(4, 2).text = '2%'
table.cell(5, 0).text = '研究生'
table.cell(5, 1).text = '3'
table.cell(5, 2).text = '1%'
table.cell(6, 0).text = '总计'
table.cell(6, 1).text = '290'
table.cell(6, 2).text = '100%'

doc.add_picture('./2.png', width=Cm(15))
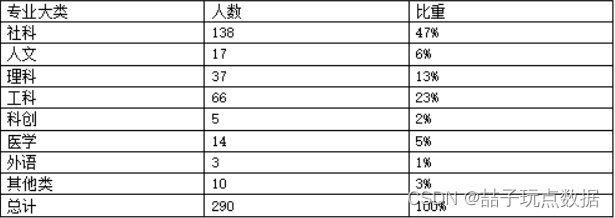
h5 = doc.add_heading('(三)专业大类分布', level=3)
h5.style.font.color.rgb = RGBColor(0, 0, 0)
h5.style.font.size = Pt(15)
table = doc.add_table(10, 3, style="Light Grid")
table.cell(0, 0).text = '专业大类'
table.cell(0, 1).text = '人数'
table.cell(0, 2).text = '比重'
table.cell(1, 0).text = '社科'
table.cell(1, 1).text = '138'
table.cell(1, 2).text = '47%'
table.cell(2, 0).text = '人文'
table.cell(2, 1).text = '17'
table.cell(2, 2).text = '6%'
table.cell(3, 0).text = '理科'
table.cell(3, 1).text = '37'
table.cell(3, 2).text = '13%'
table.cell(4, 0).text = '工科'
table.cell(4, 1).text = '66'
table.cell(4, 2).text = '23%'
table.cell(5, 0).text = '科创'
table.cell(5, 1).text = '5'
table.cell(5, 2).text = '2%'
table.cell(6, 0).text = '医学'
table.cell(6, 1).text = '14'
table.cell(6, 2).text = '5%'
table.cell(7, 0).text = '外语'
table.cell(7, 1).text = '3'
table.cell(7, 2).text = '1%'
table.cell(8, 0).text = '其他类'
table.cell(8, 1).text = '10'
table.cell(8, 2).text = '3%'
table.cell(9, 0).text = '总计'
table.cell(9, 1).text = '290'
table.cell(9, 2).text = '100%'
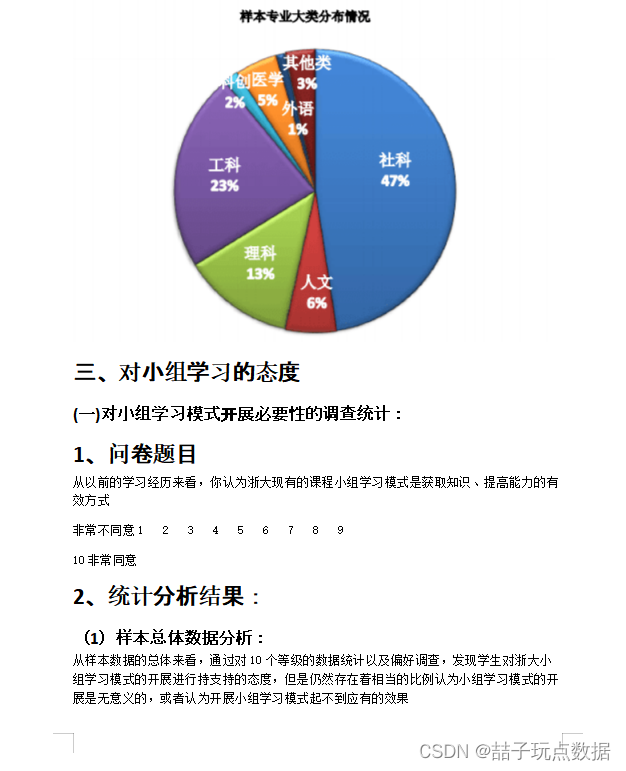
原文再现:三、对小组学习的态度
(一)对小组学习模式开展必要性的调查统计:1、问卷题目:
从以前的学习经历来看,你认为浙大现有的课程小组学习模式是获取知识、提高能力的有效方式。
非常不同意1 2 3 4 5 6 7 8 9
10非常同意
2、统计分析结果t(1)样本总体数据分析t
从样本数据的总体来看,通过对10个等级的数据统计以及偏好调查,发现学生对浙大小组学习模式的开展进行持支持的态度,但是仍然存在着相当的比例认为小组学习模式的开展是无意义的,或者认为开展小组学习模式起不到应有的效果。
doc.add_picture('./3.png', width=Cm(15))

h6 = doc.add_heading('三、对小组学习的态度', level=2)
h6.style.font.color.rgb = RGBColor(0, 0, 0)
h6.style.font.size = Pt(20)

h7 = doc.add_heading('(一)对小组学习模式开展必要性的调查统计:', level=3)
h7.style.font.color.rgb = RGBColor(0, 0, 0)
h7.style.font.size = Pt(15)

h7 = doc.add_heading('1、问卷题目', level=2)
h7.style.font.color.rgb = RGBColor(0, 0, 0)
h7.style.font.size = Pt(20)
p9=doc.add_paragraph('从以前的学习经历来看,你认为浙大现有的课程小组学习模式是获取知识、提高能力的有效方式')
p10 = doc.add_paragraph('非常不同意')
run13 = p10.add_run('1   2   3   4   5   6   7   8   9')
p11 = doc.add_paragraph('10')
run14 = p11.add_run('非常同意 ')

h8 = doc.add_heading('2、统计分析结果:', level=2)
h8.style.font.color.rgb = RGBColor(0, 0, 0)
h8.style.font.size = Pt(20)

h9 = doc.add_heading('(1)样本总体数据分析:', level=3)
h9.style.font.color.rgb = RGBColor(0, 0, 0)
h9.style.font.size = Pt(15)
p11=doc.add_paragraph('从样本数据的总体来看,通过对10个等级的数据统计以及偏好调查,发现学生对浙大小组学习模式的开展进行持支持的态度,但是仍然存在着相当的比例认为小组学习模式的开展是无意义的,或者认为开展小组学习模式起不到应有的效果')
doc.save(‘./作业.docx’)
本文含有隐藏内容,请 开通VIP 后查看