先看展示效果:
可以调整行宽、列宽、自定义字段图标、表头图标、添加排序、显示总计、小计等

首先确保搭建一个vue3项目环境,从0开始的小伙伴着重看第一点:
一、搭建vue3项目环境
首先创建一个vue3+vite+ts项目,可以查看下面相关文章,只看第一条即可
如何创建一个vite+vue3+ts项目(小白必看)_vite+ts+vue3项目创建-CSDN博客
创建好vue3项目之后就可以进行第二步
二、 安装antv-S2
可以查看官网:S2
1、在项目中安装(npm/pnpm都可以)
pnpm add @antv/s2@next @antv/s2-vue@next ant-design-vue@3.x2、也可以再安装一下用于高级排序、下钻的组件库
pnpm add ant-design-vue@3.x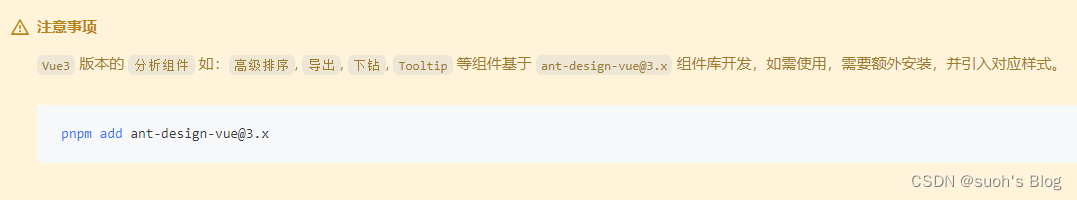
3、安装好以后就可以直接通过官网的例子进行测验
tests2.vue
<template>
  <SheetComponent :dataCfg="dataCfg" :options="options" />
</template>

<script setup lang="ts">
import type { S2Options } from "@antv/s2";
import { SheetComponent } from "@antv/s2-vue";
import { reactive, shallowRef } from "vue";
import "@antv/s2-vue/dist/style.min.css";

// dataCfg 数据字段较多,建议使用 shallow, 如果有数据更改直接替换整个对象
const s2Options = {};
const s2DataConfig = {
  fields: {
    rows: ["province", "city"],
    columns: ["type"],
    values: ["price"],
  },
  data: [
    {
      province: "浙江",
      city: "杭州",
      type: "笔",
      price: "1",
    },
    {
      province: "浙江",
      city: "杭州",
      type: "纸张",
      price: "2",
    },
    {
      province: "浙江",
      city: "舟山",
      type: "笔",
      price: "17",
    },
    {
      province: "浙江",
      city: "舟山",
      type: "纸张",
      price: "6",
    },
    {
      province: "吉林",
      city: "长春",
      type: "笔",
      price: "8",
    },
    {
      province: "吉林",
      city: "白山",
      type: "笔",
      price: "12",
    },
    {
      province: "吉林",
      city: "长春",
      type: "纸张",
      price: "3",
    },
    {
      province: "吉林",
      city: "白山",
      type: "纸张",
      price: "25",
    },
    {
      province: "浙江",
      city: "杭州",
      type: "笔",
      cost: "0.5",
    },
    {
      province: "浙江",
      city: "杭州",
      type: "纸张",
      cost: "20",
    },
    {
      province: "浙江",
      city: "舟山",
      type: "笔",
      cost: "1.7",
    },
    {
      province: "浙江",
      city: "舟山",
      type: "纸张",
      cost: "0.12",
    },
    {
      province: "吉林",
      city: "长春",
      type: "笔",
      cost: "10",
    },
    {
      province: "吉林",
      city: "白山",
      type: "笔",
      cost: "9",
    },
    {
      province: "吉林",
      city: "长春",
      type: "纸张",
      cost: "3",
    },
    {
      province: "吉林",
      city: "白山",
      type: "纸张",
      cost: "1",
    },
  ],
};
const dataCfg = shallowRef(s2DataConfig);
const options: S2Options = reactive(s2Options);
</script>
就可以看到效果:
可以调整行宽、列宽、列排序、单个单元格详情展示、选中某列、某行等基本功能
三、一些常用配置
1、自定义字段图标
参考文档:字段标记,自定义字段图标
在s2Options中配置,代码如下:
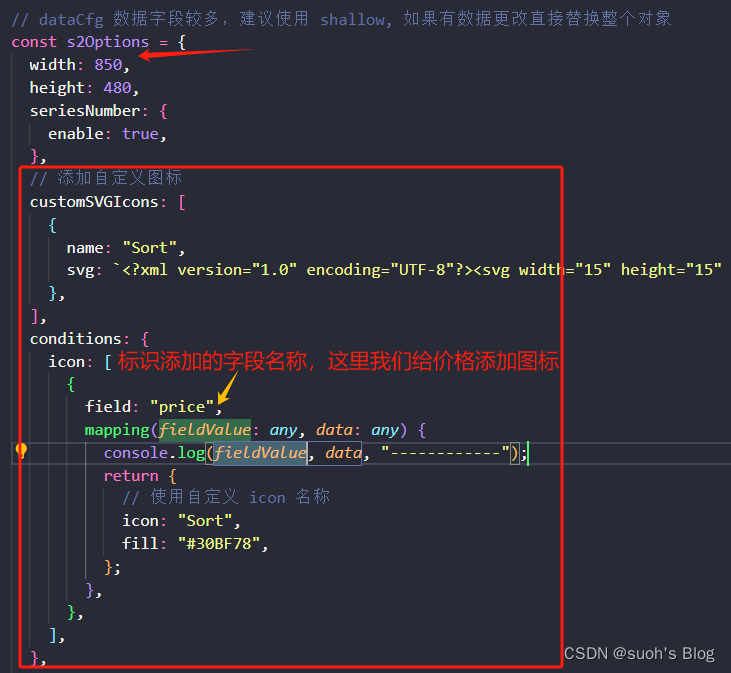
// 添加自定义图标
  customSVGIcons: [
    {
      name: "Sort",
      svg: `<?xml version="1.0" encoding="UTF-8"?><svg width="15" height="15" viewBox="0 0 48 48" fill="none" xmlns="http://www.w3.org/2000/svg"><path d="M24 42L15 29H33L24 42Z" fill="#333" stroke="#333" stroke-width="4" stroke-linejoin="miter"/><path d="M24 6L15 19H33L24 6Z" fill="#333" stroke="#333" stroke-width="4" stroke-linejoin="miter"/></svg>`,
    },
  ],
  conditions: {
    icon: [
      {
        field: "price",
        mapping(fieldValue: any, data: any) {
          console.log(fieldValue, data, "------------");
          return {
            // 使用自定义 icon 名称
            icon: "Sort",
            fill: "#30BF78",
          };
        },
      },
    ],
  },
效果是:

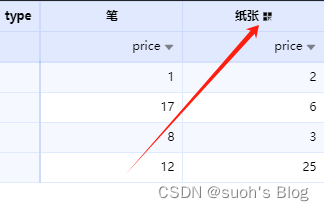
2、自定义表头图标
同样是在s2Options配置项中设置
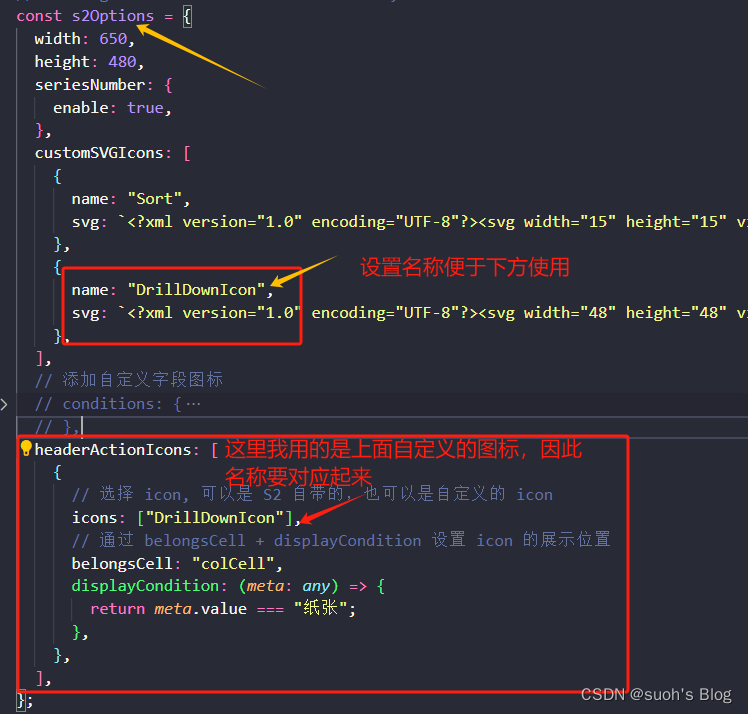
customSVGIcons: [
    {
      name: "Sort",
      svg: `<?xml version="1.0" encoding="UTF-8"?><svg width="15" height="15" viewBox="0 0 48 48" fill="none" xmlns="http://www.w3.org/2000/svg"><path d="M24 42L15 29H33L24 42Z" fill="#333" stroke="#333" stroke-width="4" stroke-linejoin="miter"/><path d="M24 6L15 19H33L24 6Z" fill="#333" stroke="#333" stroke-width="4" stroke-linejoin="miter"/></svg>`,
    },
    {
      name: "DrillDownIcon",
      svg: `<?xml version="1.0" encoding="UTF-8"?><svg width="48" height="48" viewBox="0 0 48 48" fill="none" xmlns="http://www.w3.org/2000/svg"><path d="M20 6H6V20H20V6Z" fill="none" stroke="#000000" stroke-width="2" stroke-linecap="square" stroke-linejoin="miter"/><path d="M20 28H6V42H20V28Z" fill="none" stroke="#000000" stroke-width="2" stroke-linecap="square" stroke-linejoin="miter"/><path d="M42 6H28V20H42V6Z" fill="none" stroke="#000000" stroke-width="2" stroke-linecap="square" stroke-linejoin="miter"/><path d="M28 28L42 42M28 28H42H28ZM28 28V42V28Z" stroke="#000000" stroke-width="2" stroke-linecap="square" stroke-linejoin="miter"/></svg>`,
    },
  ],
headerActionIcons: [
    {
      // 选择 icon, 可以是 S2 自带的,也可以是自定义的 icon
      icons: ["DrillDownIcon"],
      // 通过 belongsCell + displayCondition 设置 icon 的展示位置
      belongsCell: "colCell",
      // 可以在displayCondition中通过meta拿到表头信息,设置满足一定条件的表头再显示图标
      displayCondition: (meta: any) => {
        return meta.value === "纸张";
      },
    },
  ],
效果是:
我们只让纸张的表头显示图标
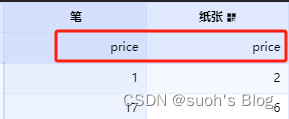
3、关闭默认排序 icon
表格的数值默认会渲染排序 icon, 可以配置 showDefaultHeaderActionIcon关闭。

效果:
可以看到price的默认排序图标被去掉了
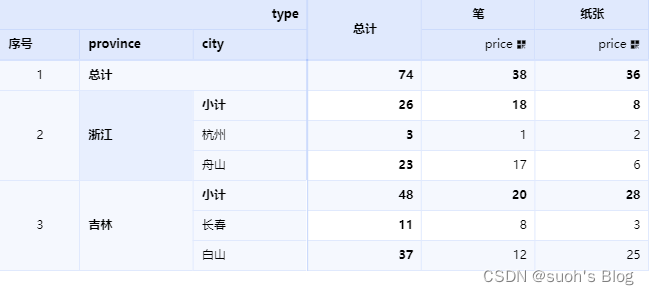
4、显示小计、总计
可以查看官方文档:S2-显示小计、总计
Totals 属性
功能描述: 行/列小计总计配置
| 参数 | 说明 | 类型 | 默认值 | 必选 |
|---|---|---|---|---|
| row | 列总计 | Total | - | |
| col | 行总计 | Total | - |
| 参数 | 说明 | 类型 | 默认值 | 必选 |
|---|---|---|---|---|
| showGrandTotals | 是否显示总计 | boolean |
false | ✓ |
| showSubTotals | 是否显示小计。当配置为对象时,always 控制是否在子维度不足 2 个时始终展示小计,默认不展示。 | boolean | { always: boolean } |
false | ✓ |
| subTotalsDimensions | 小计的汇总维度 | string[] |
[] | ✓ |
| reverseGrandTotalsLayout | 总计布局位置,默认下或右 | boolean |
false | ✓ |
| reverseSubTotalsLayout | 小计布局位置,默认下或右 | boolean |
false | ✓ |
| label | 总计别名 | string |
||
| subLabel | 小计别名 | string |
||
| calcGrandTotals | 自定义-计算总计 | CalcTotals |
||
| calcSubTotals | 自定义-计算小计 | CalcTotals |
  totals: {
    //小计总计算配置
    row: {
      showGrandTotals: true, // 是否显示总计
      showSubTotals: true, // 是否显示小计。
      reverseGrandTotalsLayout: true, // 总计布局位置,默认下或右
      reverseSubTotalsLayout: true, // 小计布局位置,默认下或右
      subTotalsDimensions: ["province"], // 小计的汇总维度
      calcGrandTotals: {
        aggregation: "SUM",
      },
      calcSubTotals: {
        aggregation: "SUM",
      },
    },
    col: {
      showGrandTotals: true,
      showSubTotals: true,
      reverseGrandTotalsLayout: true,
      reverseSubTotalsLayout: true,
      subTotalsDimensions: ["type"],
      calcGrandTotals: {
        aggregation: "SUM",
      },
      calcSubTotals: {
        aggregation: "SUM",
      },
    },
  },
效果:
可以通过上面设置的SUM函数自动计算出数值,也可以自定义累加函数
自定义函数也可以达到效果:
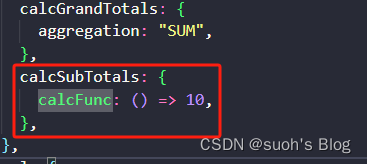

优先级
数据传入优先级高于计算数据
配置自定义方法优先级大于配置聚合方式,即配置
calcFunc > aggregation当同一个单元格为
行+列汇总值时,优先级为:列总计/列小计 > 行总计/行小计
四、完整代码
<template>
  <SheetComponent :dataCfg="dataCfg" :options="options" />
</template>

<script setup lang="ts">
// import type { S2Options } from "@antv/s2";
import { SheetComponent } from "@antv/s2-vue";
import { reactive, shallowRef } from "vue";
import "@antv/s2-vue/dist/style.min.css";

const s2Options = {
  showDefaultHeaderActionIcon: false,
  width: 650,
  height: 480,
  seriesNumber: {
    enable: true,
  },
  totals: {
    //小计总计算配置
    row: {
      showGrandTotals: true, // 是否显示总计
      showSubTotals: true, // 是否显示小计。
      reverseGrandTotalsLayout: true, // 总计布局位置,默认下或右
      reverseSubTotalsLayout: true, // 小计布局位置,默认下或右
      subTotalsDimensions: ["province"], // 小计的汇总维度
      calcGrandTotals: {
        aggregation: "SUM",
      },
      calcSubTotals: {
        calcFunc: () => 10,
      },
    },
    col: {
      showGrandTotals: true,
      showSubTotals: true,
      reverseGrandTotalsLayout: true,
      reverseSubTotalsLayout: true,
      subTotalsDimensions: ["type"],
      calcGrandTotals: {
        aggregation: "SUM",
      },
      calcSubTotals: {
        aggregation: "SUM",
      },
    },
  },
  customSVGIcons: [
    {
      name: "Sort",
      svg: `<?xml version="1.0" encoding="UTF-8"?><svg width="15" height="15" viewBox="0 0 48 48" fill="none" xmlns="http://www.w3.org/2000/svg"><path d="M24 42L15 29H33L24 42Z" fill="#333" stroke="#333" stroke-width="4" stroke-linejoin="miter"/><path d="M24 6L15 19H33L24 6Z" fill="#333" stroke="#333" stroke-width="4" stroke-linejoin="miter"/></svg>`,
    },
    {
      name: "DrillDownIcon",
      svg: `<?xml version="1.0" encoding="UTF-8"?><svg width="48" height="48" viewBox="0 0 48 48" fill="none" xmlns="http://www.w3.org/2000/svg"><path d="M20 6H6V20H20V6Z" fill="none" stroke="#000000" stroke-width="2" stroke-linecap="square" stroke-linejoin="miter"/><path d="M20 28H6V42H20V28Z" fill="none" stroke="#000000" stroke-width="2" stroke-linecap="square" stroke-linejoin="miter"/><path d="M42 6H28V20H42V6Z" fill="none" stroke="#000000" stroke-width="2" stroke-linecap="square" stroke-linejoin="miter"/><path d="M28 28L42 42M28 28H42H28ZM28 28V42V28Z" stroke="#000000" stroke-width="2" stroke-linecap="square" stroke-linejoin="miter"/></svg>`,
    },
  ],
  // 添加自定义字段图标
  // conditions: {
  //   icon: [
  //     {
  //       field: "price",
  //       mapping(fieldValue: any, data: any) {
  //         console.log(fieldValue, data);
  //         return {
  //           // 使用自定义 icon 名称
  //           icon: "Sort",
  //           fill: "#30BF78",
  //         };
  //       },
  //     },
  //     {
  //       field: "type",
  //       mapping(fieldValue: any) {
  //         console.log(fieldValue, "------------");
  //         if (fieldValue !== "type") {
  //           return {
  //             icon: "Sort",
  //             fill: "#025DF4",
  //           };
  //         }
  //       },
  //     },
  //   ],
  // },
  headerActionIcons: [
    {
      // 选择 icon, 可以是 S2 自带的,也可以是自定义的 icon
      defaultHide: true,
      icons: ["DrillDownIcon"],
      // 通过 belongsCell + displayCondition 设置 icon 的展示位置
      belongsCell: "colCell",
      displayCondition: (meta: any) => {
        return meta.value === "price";
      },
    },
  ],
};
const s2DataConfig = {
  showDefaultHeaderActionIcon: false,
  fields: {
    rows: ["province", "city"],
    columns: ["type"],
    values: ["price"],
  },
  data: [
    {
      province: "浙江",
      city: "杭州",
      type: "笔",
      price: "1",
    },
    {
      province: "浙江",
      city: "杭州",
      type: "纸张",
      price: "2",
    },
    {
      province: "浙江",
      city: "舟山",
      type: "笔",
      price: "17",
    },
    {
      province: "浙江",
      city: "舟山",
      type: "纸张",
      price: "6",
    },
    {
      province: "吉林",
      city: "长春",
      type: "笔",
      price: "8",
    },
    {
      province: "吉林",
      city: "白山",
      type: "笔",
      price: "12",
    },
    {
      province: "吉林",
      city: "长春",
      type: "纸张",
      price: "3",
    },
    {
      province: "吉林",
      city: "白山",
      type: "纸张",
      price: "25",
    },
    {
      province: "浙江",
      city: "杭州",
      type: "笔",
      cost: "0.5",
    },
    {
      province: "浙江",
      city: "杭州",
      type: "纸张",
      cost: "20",
    },
    {
      province: "浙江",
      city: "舟山",
      type: "笔",
      cost: "1.7",
    },
    {
      province: "浙江",
      city: "舟山",
      type: "纸张",
      cost: "0.12",
    },
    {
      province: "吉林",
      city: "长春",
      type: "笔",
      cost: "10",
    },
    {
      province: "吉林",
      city: "白山",
      type: "笔",
      cost: "9",
    },
    {
      province: "吉林",
      city: "长春",
      type: "纸张",
      cost: "3",
    },
    {
      province: "吉林",
      city: "白山",
      type: "纸张",
      cost: "1",
    },
  ],
};
const dataCfg = shallowRef(s2DataConfig);
const options: any = reactive(s2Options);
</script>
还有一些自定义tooltip、单元格点击事件等功能,下篇文章更新哦~