9. 转换类型
9.1转换成浮点数类型
dst=img_as_float(img)
9.2转换成无符号字节类型
dst1=img_as_ubyte(img)
from skimage import data,img_as_float,io
img = io.imread(r"C:\Users\song\Desktop\2.jpg")
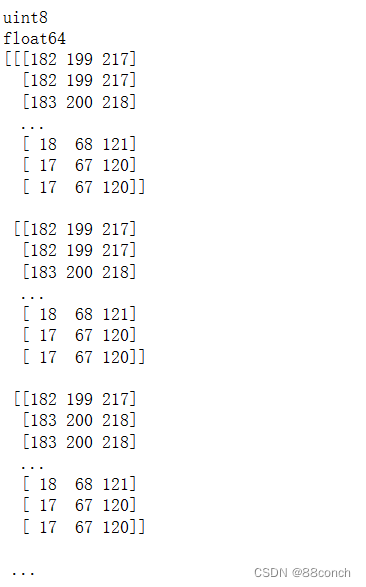
print(img.dtype.name)
dst=img_as_float(img)
dst1=img_as_ubyte(img)
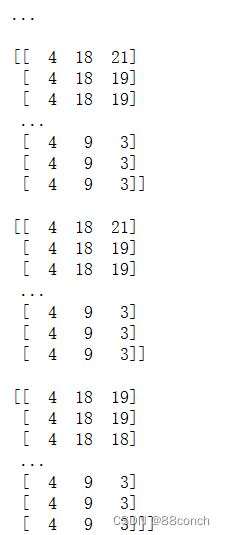
print(dst.dtype.name)
print(img)
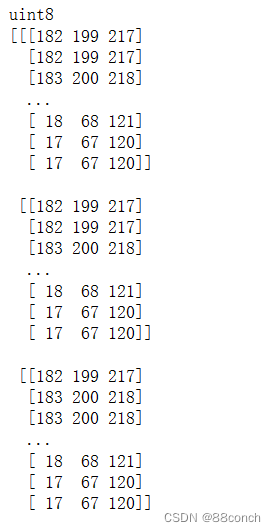
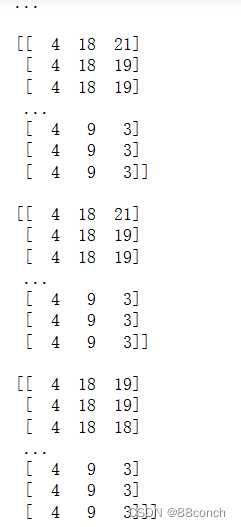
print(dst1.dtype.name)
print(img)
运行结果:
10.颜色空间转换
10.1RGB转GRAY
from skimage import io, color
img = io.imread(r"C:\Users\song\Desktop\2.jpg")
gray = color.rgb2gray(img)
io.imshow(gray)
运行结果:
10.2RGB转HSV
from skimage import io, color
img = io.imread(r"C:\Users\song\Desktop\2.jpg")
hsv = color.rgb2hsv(img)
io.imshow(hsv)
运行结果:
10.3RGB转LAB
from skimage import io, color
img = io.imread(r"C:\Users\song\Desktop\2.jpg")
lab = color.rgb2lab(img)
io.imshow(lab)
运行结果:
10.4HSV转RGB
from skimage import io, color
img = io.imread(r"C:\Users\song\Desktop\2.jpg")
hsv2 = color.hsv2rgb(img)
io.imshow(hsv2)
运行结果:
10.5LAB转RGB
from skimage import io, color
img = io.imread(r"C:\Users\song\Desktop\2.jpg")
lab2 = color.lab2rgb(img)
io.imshow(lab2)
运行结果:
10.6 convert_colorspace函数进行颜色转换
from skimage import io, color
img = io.imread(r"C:\Users\song\Desktop\2.jpg")
hsv = color.convert_colorspace(img,'RGB','HSV')
io.imshow(hsv)
运行结果:
11.标签化处理图像
11.1导入模块
from skimage import io,data,color
import cv2
11.2加载图片
image = cv2.imread(r"C:\Users\song\Desktop\2.jpg")
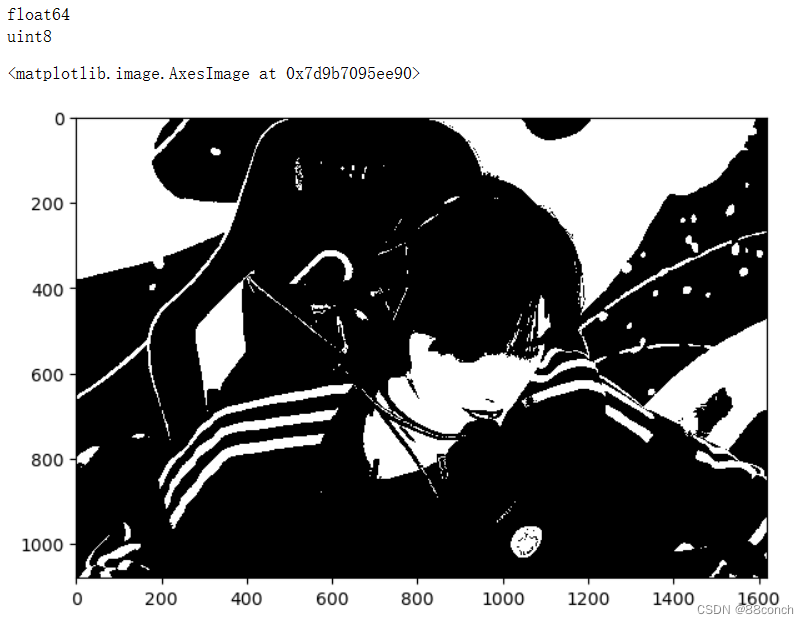
11.3RGB图像转灰度图像
img_gray = color.rgb2gray(image)
rows,cols=img_gray.shape
11.4遍历图像
for i in range(rows):
    for j in range(cols):
        if (img_gray[i,j]<=0.5):
            img_gray[i,j]=0
        else:
            img_gray[i,j]=1
11.5打印图像并显示
print(img_gray.dtype.name)
dst=img_as_ubyte(img_gray) # 从浮点型转换成8位无符号整形
print(dst.dtype.name)
io.imshow(dst)
运行结果:
12.颜色图谱
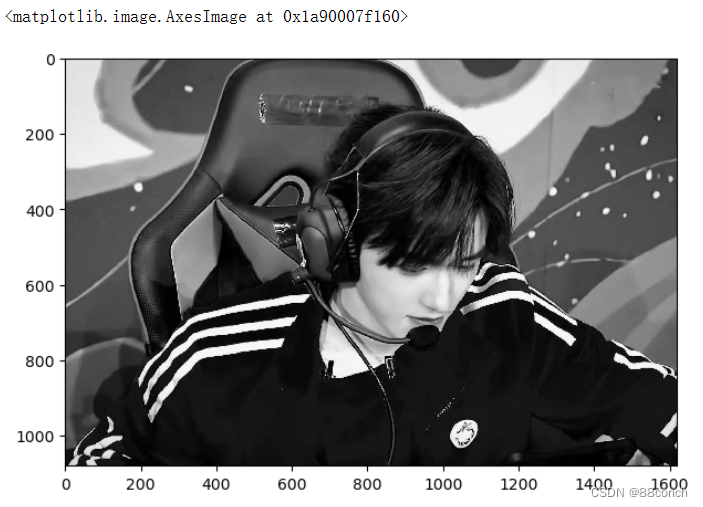
12.1None
import matplotlib.pyplot as plt
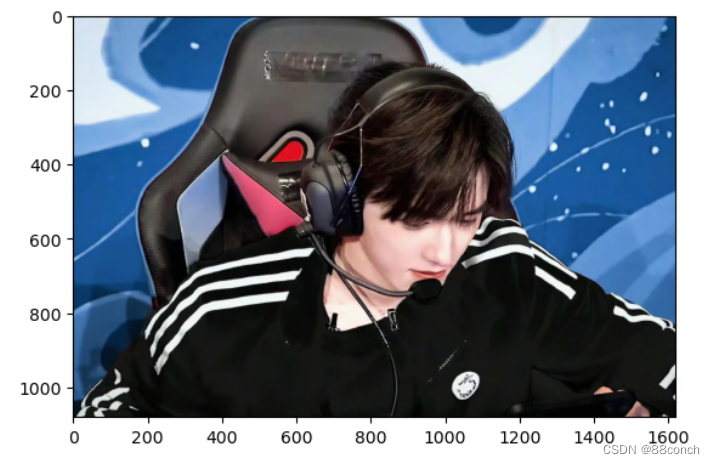
img = io.imread(r"C:\Users\song\Desktop\2.jpg")
plt.imshow(img, cmap=None)
运行结果:
12.2autumn
import matplotlib.pyplot as plt
img = io.imread(r"C:\Users\song\Desktop\2.jpg")
plt.imshow(img, cmap='autumn') # 将'autumn'作为字符串传递给cmap参数
plt.show()
运行结果:

12.3bone
import matplotlib.pyplot as plt
img = io.imread(r"C:\Users\song\Desktop\2.jpg")
plt.imshow(img, cmap='bone')
plt.show()
运行结果:

12.4cool
import matplotlib.pyplot as plt
img = io.imread(r"C:\Users\song\Desktop\2.jpg")
plt.imshow(img, cmap='cool')
plt.show()
运行结果:

12.5copper
import matplotlib.pyplot as plt
img = io.imread(r"C:\Users\song\Desktop\2.jpg")
plt.imshow(img, cmap='copper')
plt.show()
运行结果:

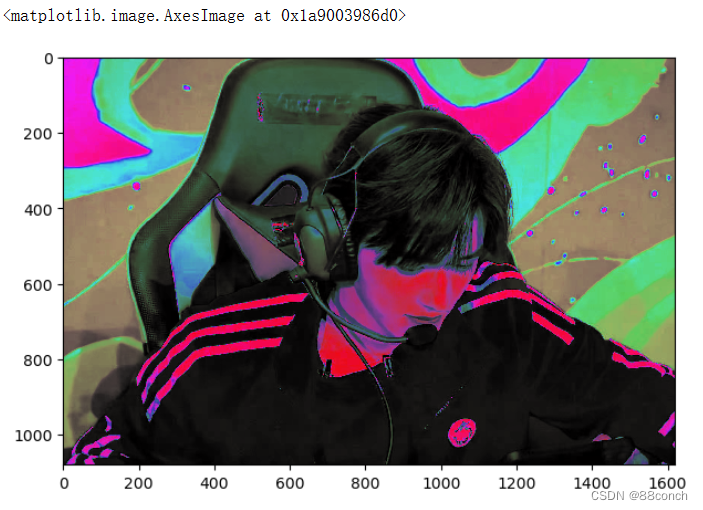
12.6flag
import matplotlib.pyplot as plt
img = io.imread(r"C:\Users\song\Desktop\2.jpg")
plt.imshow(img, cmap='flag')
plt.show()
运行结果:

12.7gray
import matplotlib.pyplot as plt
img = io.imread(r"C:\Users\song\Desktop\2.jpg")
plt.imshow(img, cmap='gray')
plt.show()
运行结果:

12.8hot
import matplotlib.pyplot as plt
img = io.imread(r"C:\Users\song\Desktop\2.jpg")
plt.imshow(img, cmap='hot')
plt.show()
运行结果:

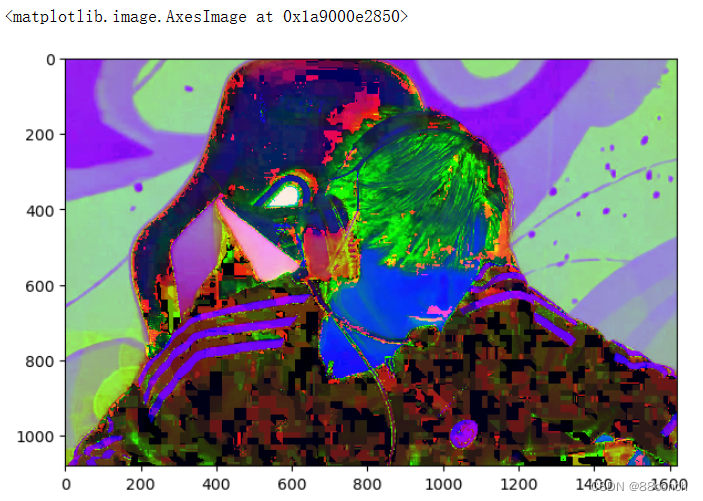
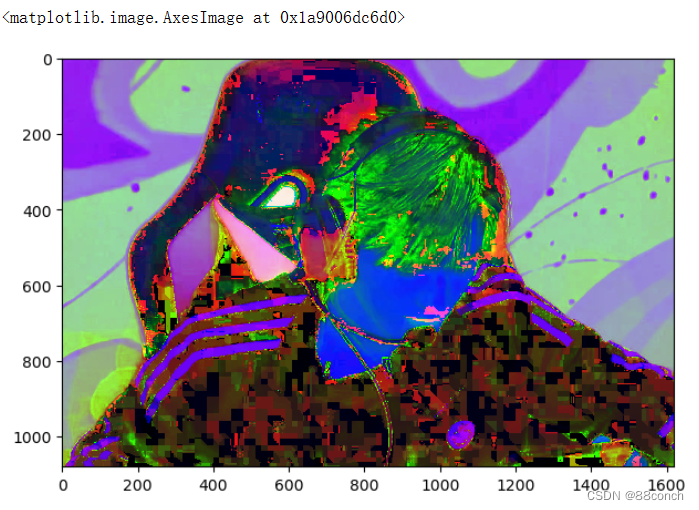
12.9hsv
import matplotlib.pyplot as plt
img = io.imread(r"C:\Users\song\Desktop\2.jpg")
plt.imshow(img, cmap='hsv')
plt.show()
运行结果:

12.10inferno
import matplotlib.pyplot as plt
img = io.imread(r"C:\Users\song\Desktop\2.jpg")
plt.imshow(img, cmap='inferno')
plt.show()
运行结果:

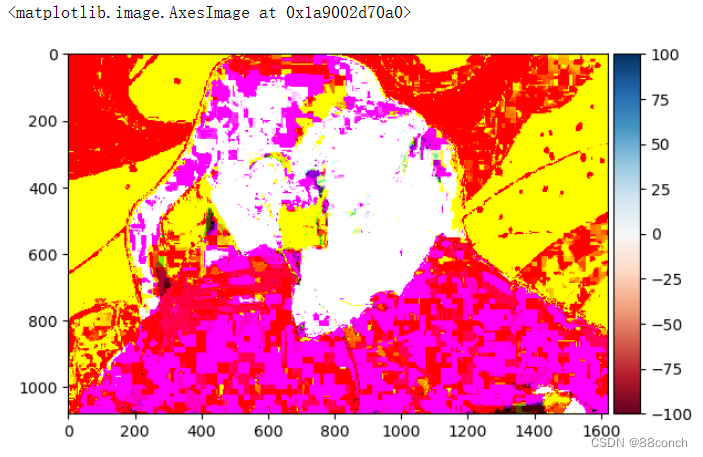
12.11jet
import matplotlib.pyplot as plt
img = io.imread(r"C:\Users\song\Desktop\2.jpg")
plt.imshow(img, cmap='jet')
plt.show()
运行结果:

12.12magma
import matplotlib.pyplot as plt
img = io.imread(r"C:\Users\song\Desktop\2.jpg")
plt.imshow(img, cmap='magma')
plt.show()
运行结果:

12.13pink
import matplotlib.pyplot as plt
img = io.imread(r"C:\Users\song\Desktop\2.jpg")

plt.imshow(img, cmap='pink')
plt.show()
运行结果:

12.14plasma
import matplotlib.pyplot as plt
img = io.imread(r"C:\Users\song\Desktop\2.jpg")
plt.imshow(img, cmap='plasma')
plt.show()
运行结果:
12.15prism
import matplotlib.pyplot as plt
img = io.imread(r"C:\Users\song\Desktop\2.jpg")
plt.imshow(img, cmap='prism')
plt.show()
运行结果:

12.16spring
import matplotlib.pyplot as plt
img = io.imread(r"C:\Users\song\Desktop\2.jpg")
plt.imshow(img, cmap='spring')
plt.show()
运行结果:

12.17summer
import matplotlib.pyplot as plt
img = io.imread(r"C:\Users\song\Desktop\2.jpg")
plt.imshow(img, cmap='summer')
plt.show()
运行结果:

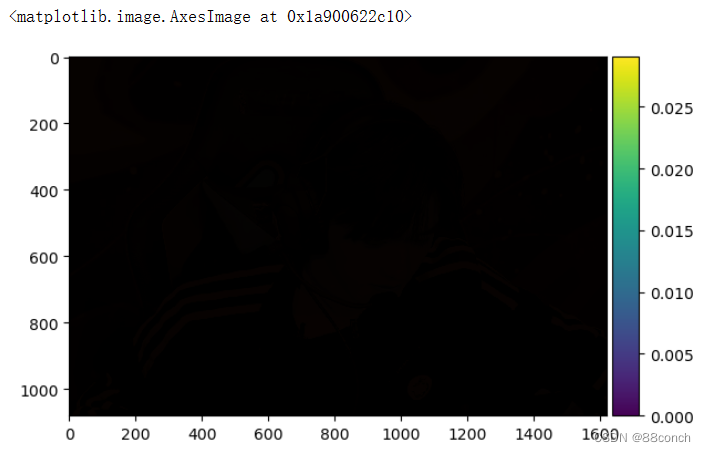
12.18viridis
import matplotlib.pyplot as plt
img = io.imread(r"C:\Users\song\Desktop\2.jpg")
plt.imshow(img, cmap='viridisr')
plt.show()
运行结果:

12.19winter
import matplotlib.pyplot as plt
img = io.imread(r"C:\Users\song\Desktop\2.jpg")
plt.imshow(img, cmap='winter')
plt.show()
运行结果:
