Binary Machine Vision
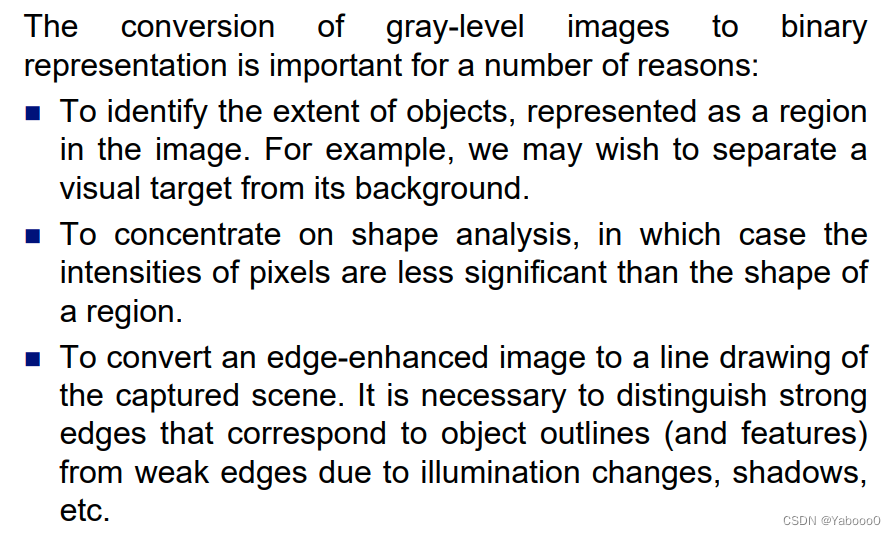
For object recognition and detection, the input image can be simplified by generating an output image whose pixels:
Tend to have high values if they are part of an objects of interest (“1” in binary image); and low values if they are not (“0” in binary image).
PS: it can also be “0” for objects and “1” for background.
Thresholding - Labelling
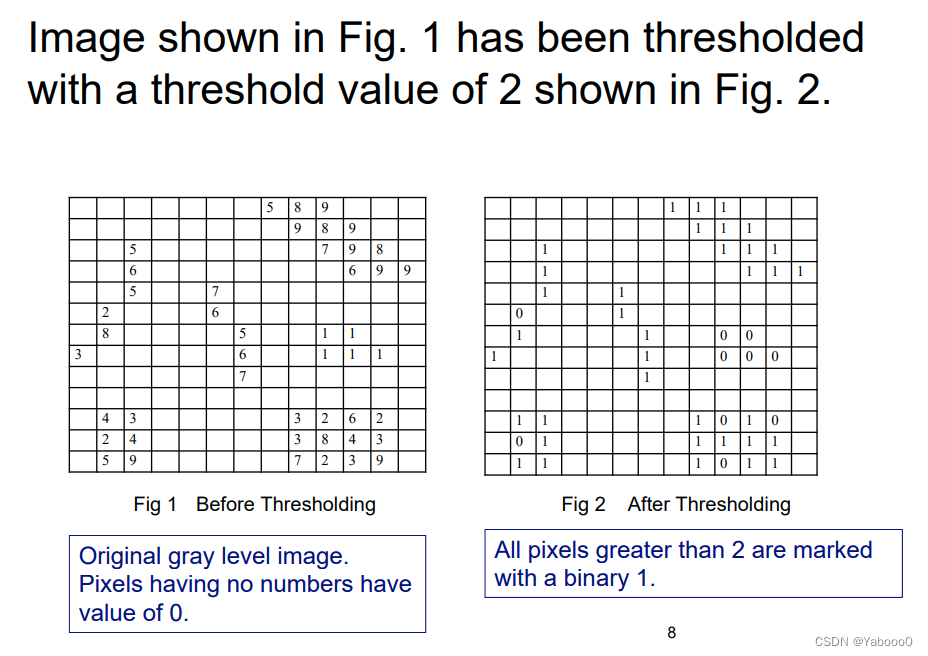
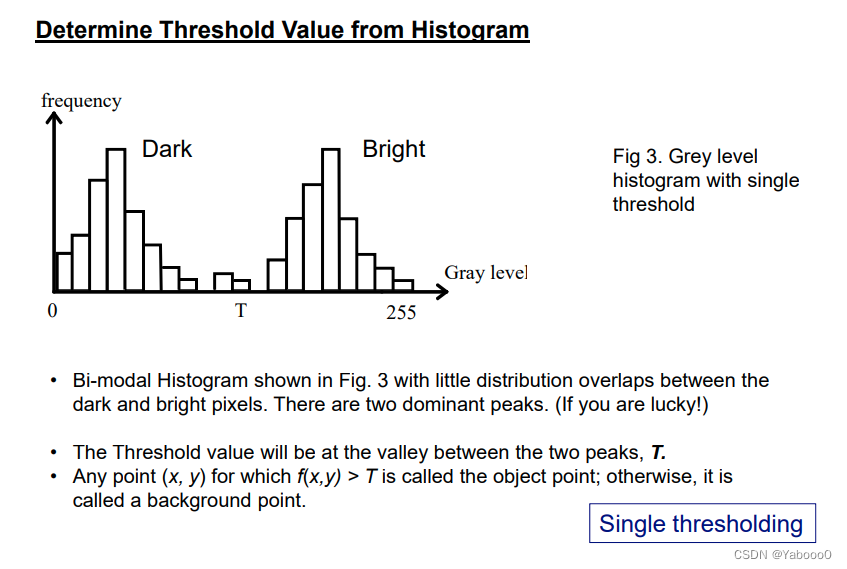
To identify an object, the easiest way is to perform a Thresholding-Labelling operation to produce a binary image.
1.Determine a threshold value.
2.Those pixels having grey value higher than the Threshold value are given the value 1. \Those pixels having grey value lower than the Threshold value are given the value 0.
The generation and analysis of such image are called Binary Machine Vision
Mathematical Definition of Thresholding:
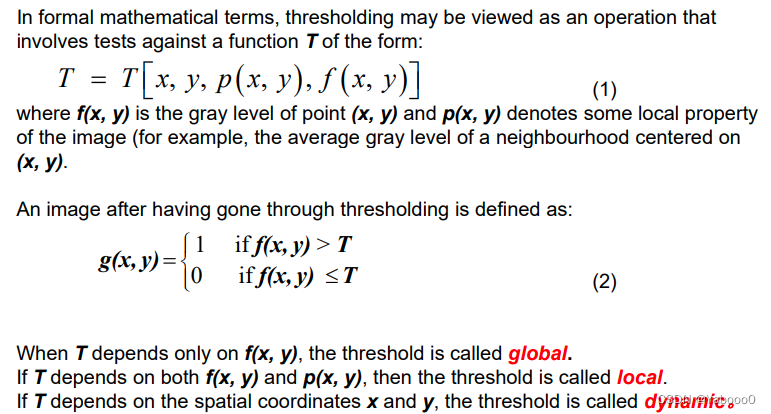
#全局、局部、动态
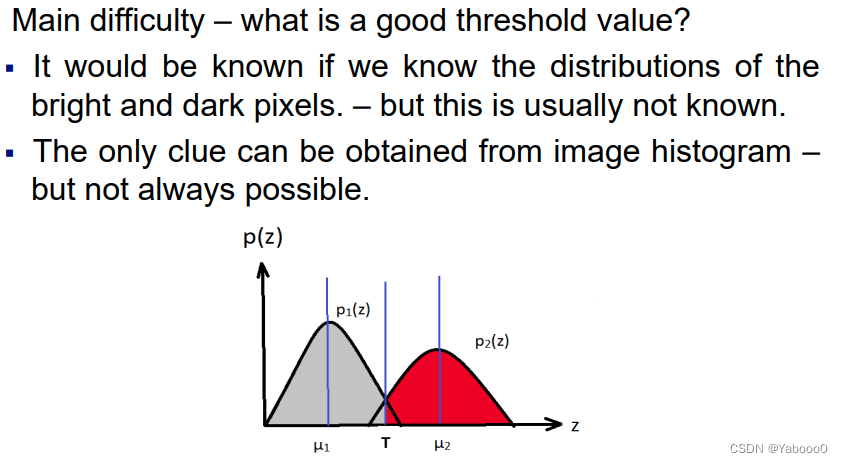
The determination of a threshold value becomes difficult:
1. When the distributions for the bright and dark pixels become more and more overlapped, the valley between the two histogram modes becomes more difficult, because the valley begins to disappear as the two distributions begin to merge together.
2. Furthermore, when there is substantial overlap, the choice of threshold as the valley point is less optimal in the sense of minimizing classification error.
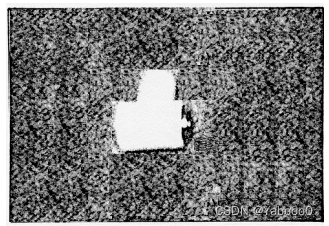
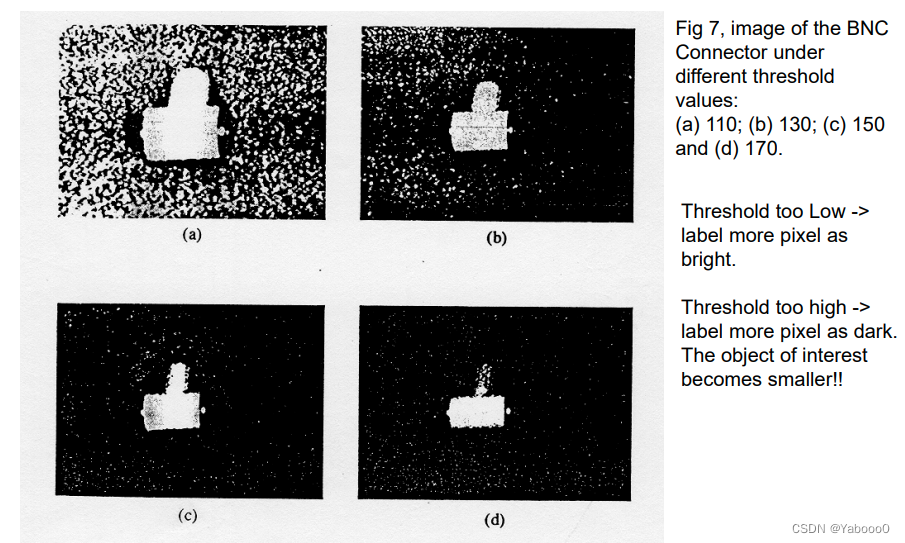
The histogram of the BNC Connector shows that it is not bi-modal, and the placement of the threshold value is very difficult.
Influence of Noise:
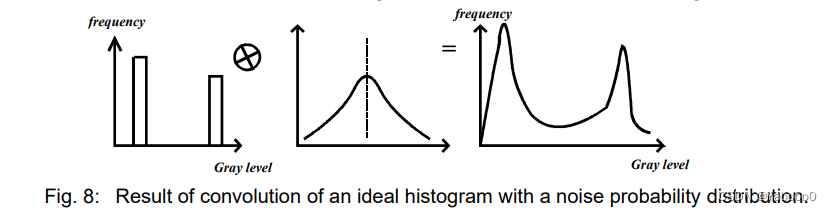
If we have a black object on a white background, the histogram will be bi-modal. With the influence of measurement noise, the histogram will be affected as shown in Fig. 8.
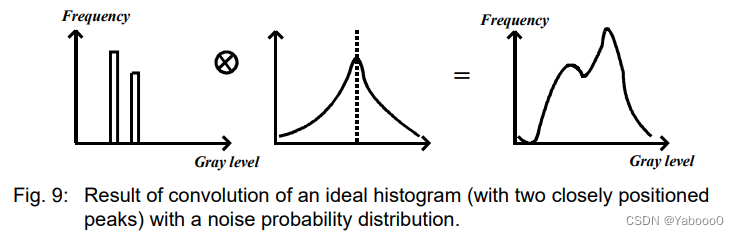
If the gray levels of the object and the background are fairly close, the influence of noise may result in the object only appearing as a shoulder in the histogram (Fig. 9). The threshold is also difficult to identify. This problem could be due to poor lighting conditions.
Convolution take two signals (input signal and impulse response) to produce the third signal.
Roles of illumination照明:
The formation of an image is the product are the illumination and the reflectance components: f(x, y) = i(x, y) r(x, y) (3)
where i(x,y) and r(x,y) are the illumination and reflectance, respectively#光照*反射率
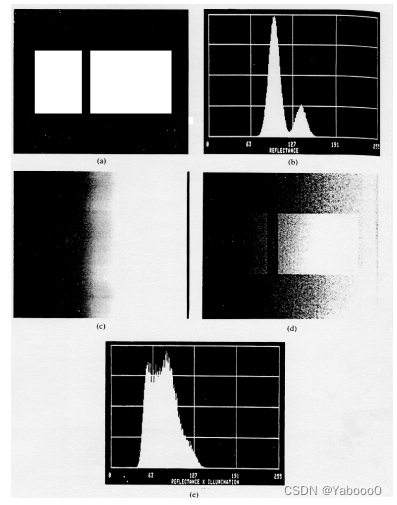
Fig. 10 shows the effect of illumination. FIg.10(a) and Fig 10(c) are the computer generated reflectance and illumination functions, respectively. Fig. 10(b) is the well defined bi-modal histogram of Fig. 10(a). Fig 10(c) is obtained through Eq. (3), and the resulting image is shown in Fig. 10(d) with the histogram shown in Fig. 10(e).
The histogram of the image shown in Fig. 10(e) does not have a clearly defined valley.
This will make the segmentation with a single threshold value very difficult. This simple illustration shows that the reflective nature of objects and background could be such that they are separable.
However, an image resulting from poor illumination could be difficult to separate
Global Thresholding
This is a simple technique and is useful to segment an image by dividing the gray levels into bands and use thresholds to determine regions or to obtain object boundaries.
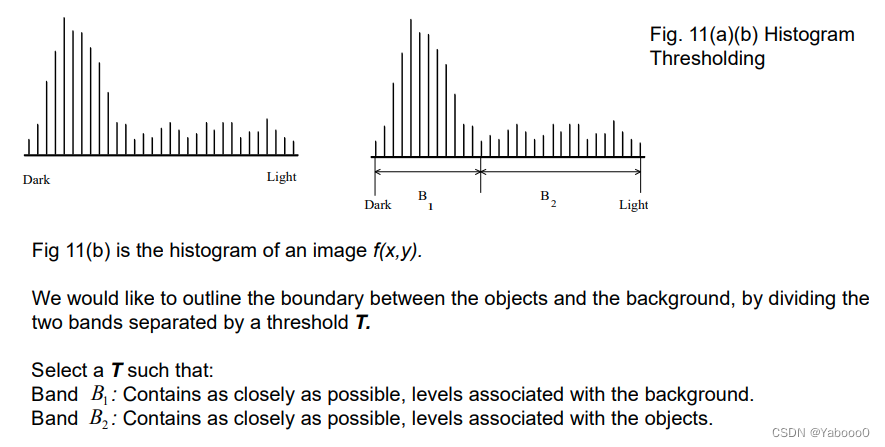
Note: the method is executed after B1 and B2 have been selected.
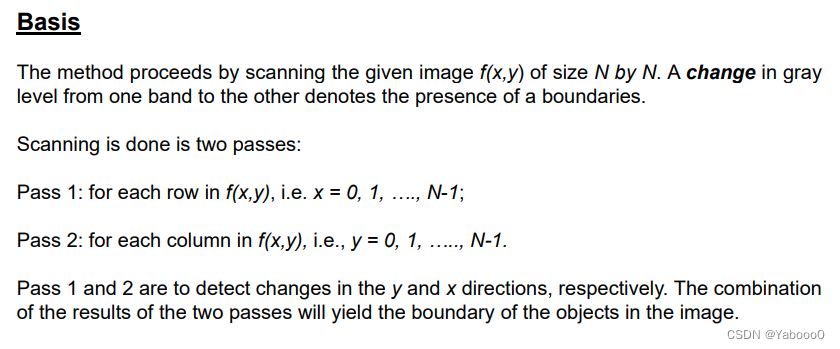
#先行后列的灰度等级,最后combination是物体边界
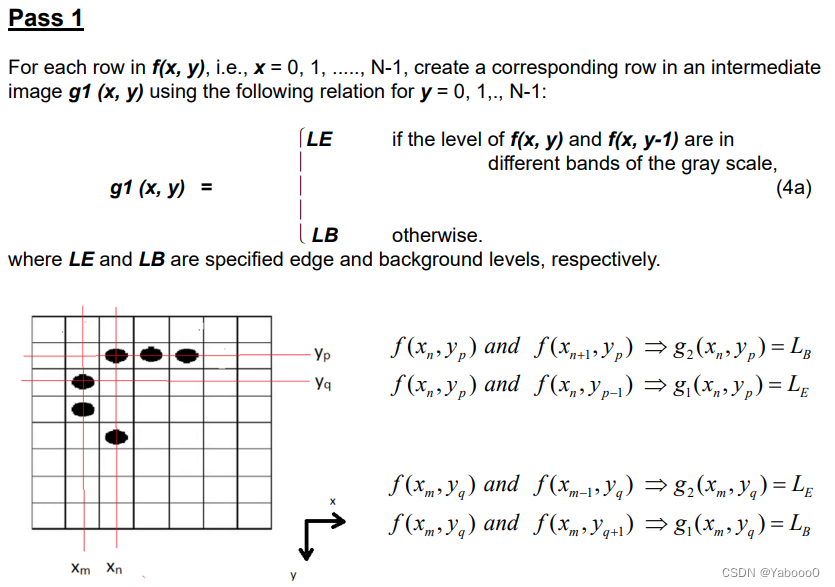
Pass1:
Pass2:
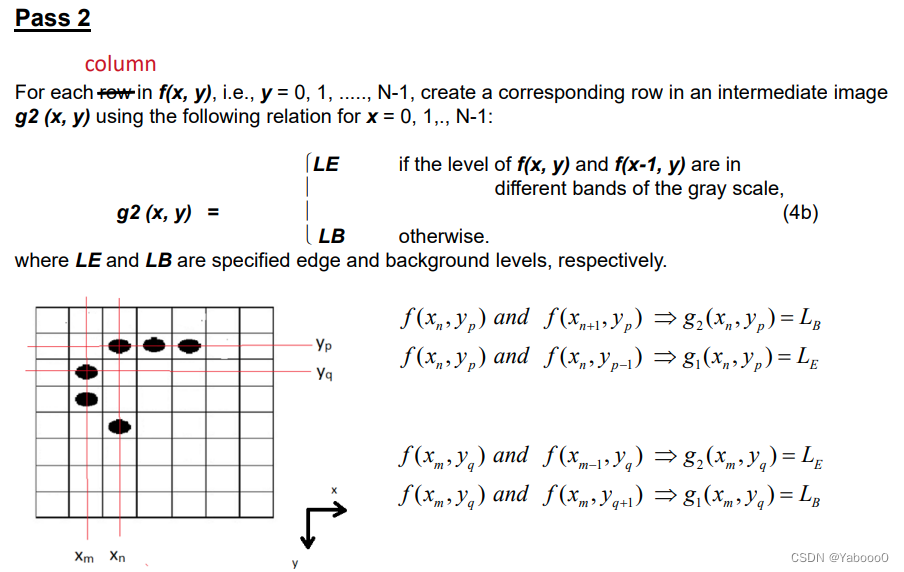
Putting them together:
The desired image, consisting of the points on the boundary of objects different (as defined by T) from the background, is obtained by using the following relation for x, y = 0, 1, ...., N-1:
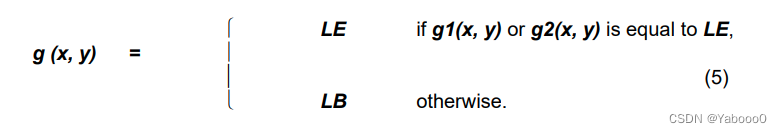
The above procedure can be generalised to more gray-level bands as the relations in Eq. (4) and (5) are based only on a change in gray-level band from one pixel to the next.
One possible extension would be to code the edge points with different gray-levels, depending on the band in which the change took place.
The problem in this multi-bands situation is where to place the thresholds.
#如果哦有一个LE,则取值LE,上述程序可以推广到更多的灰度带,因为公式(4)和(5)中的关系只基于从一个像素到下一个像素的灰度带变化。重要问题没有改变,依然是阈值的取值问题。
Threshold Selection based on Boundary Characteristics 基于边界特征的阈值选择
There are usually abrupt changes in gray level values at the boundaries between objects and background. One way to select a threshold is to consider only those pixels that lie on or near the boundary between objects and the background. Finally, using pixels that satisfy some simple measures based on gradient and Laplacian operators has a tendency to deepen the valley between histogram peaks.
The main difficult in this case, lies in deciding which pixels are on the boundary. We must look for a good edge detector.
#在物体和背景的边界处,灰度值通常有突然的变化。选择阈值的一种方法是只考虑那些位于物体和背景之间的边界上或附近的像素。最后,使用满足一些基于梯度和拉普拉斯算子的简单措施的像素,有加深直方图峰值之间的谷底的趋势。
在这种情况下,主要的困难在于决定哪些像素是在边界上。我们必须寻找一个好的边缘检测器。
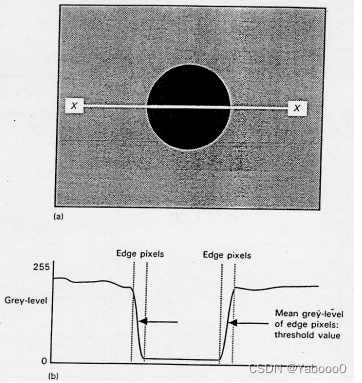
Fig:Using edge pixels to select a threshold: (a) image of dark, round object on a light background with section X-X shown; (b) profile of image intensity along section X-X.
Image segmentation refers to the partition of an image into a set of regions that cover it. The goal is for the regions to represent meaningful areas of the image#图像分割指的是将一幅图像分割成一组覆盖它的区域。其目的是让这些区域代表图像的有意义的区域
Component Labelling元素标签
Connected components analysis of a binary image consists of the connected components labelling of the binary 1 pixels followed by property measurement of the component regions and decision making.
The connected components labelling operation performs the unit change from pixel to region of segment.
All pixels that have value binary 1 are given identifying labels depends on some conditions. The label is a unique name or index of the region to which the pixels belong. The label is the identifier for a potential object region.
Connected components labeling is a grouping operation that can make a unit change from pixel to region, which is a more complex unit.
A region has a rich set of properties. It has shape and position properties as well as statistical properties of the gray levels of the pixels in the region.
We want to examine connected component labeling algorithms, which in essence group together all pixels belonging to the same region and give them the same label.
Connected Components Operators
Once a binary image is produced, a connected components labeling operator is employed to group the binary-1 pixels into maximal connected regions. These regions are called the connected components of the binary image, and the associated operator is called the connected components operator.
Its input is a binary image, and its output is a symbolic image in which the label assigned to each pixel is an integer uniquely identifying the connected component to which that pixel belongs.
#一旦产生了二元图像,就会采用一个连接成分标记算子,将二元-1像素分组为最大的连接区域。这些区域被称为二元图像的连接成分,相关的运算符被称为连接成分运算符。
它的输入是一个二进制图像,它的输出是一个符号图像,其中分配给每个像素的标签是一个整数,唯一地识别该像素所属的连接组件。
#label,并传递给相邻pixel
Connected Components Algorithms – Simple Illustration
Connected Components Algorithms – Classical Algorithm
This algorithm makes only two passes through the image, but requires a large global table for recording equivalences. The steps can be summarized below:
1.The first pass performs label propagation, just like the procedure described above. Whenever a situation arises in which two different labels can propagate to the same pixel, the smaller label propagates and each such equivalence found is entered in an equivalence table.
Each entry in the equivalent table consists of an ordered pair, the values of its components being the labels found to be equivalent.
2.After the first pass, the equivalent classes are found by taking the transitive closure of the set of equivalences recorded in the equivalent table. Each equivalent class is assigned a unique label, usually by the minimum label in the class.
3.A second pass through the image performs a translation, assigning to each pixel the label of the equivalence class of its pass-1 label.
Example:
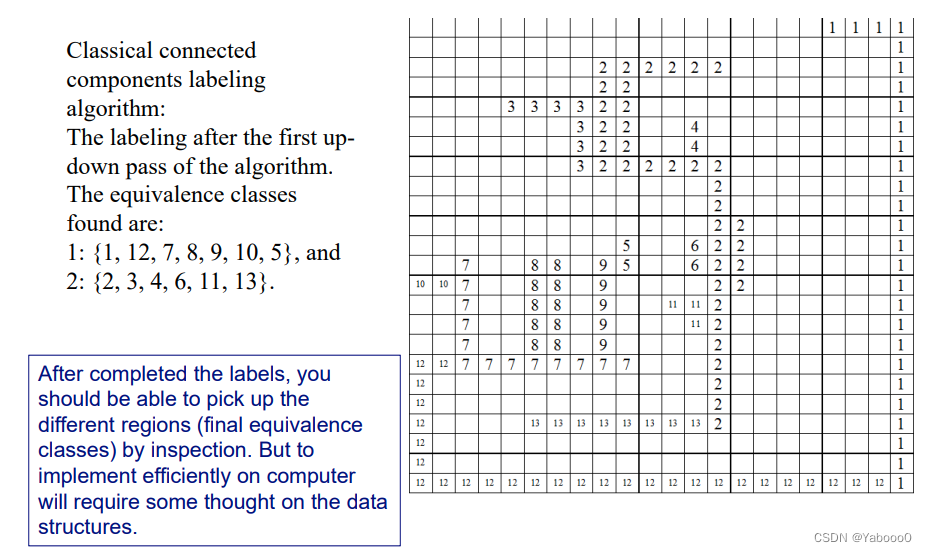
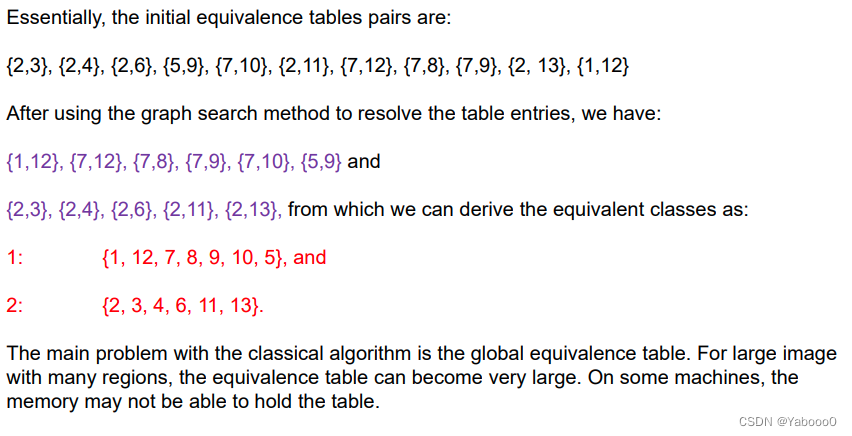
#经典算法的主要问题是全局等值表。对于有许多区域的大图像,等价表会变得非常大。在某些机器上,内存可能无法容纳该表。
PS:Graph search (or graph traversal) is the process of visiting (checking and/or updating) each vertex in a graph.图搜索(或图遍历)是访问(检查和/或更新)图中每个顶点的过程。
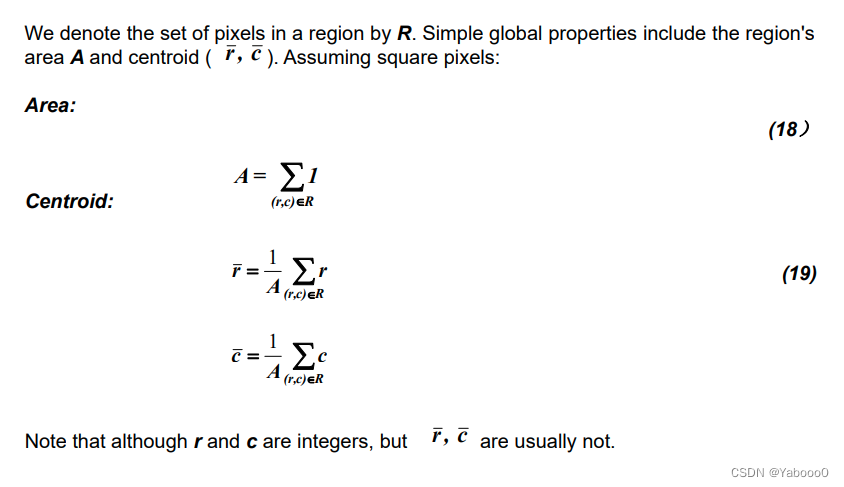
Region Analysis区域分析
It consists of computing global properties for each region produced by the connected components labeling algorithm.
The properties of each region or segment are stored as a measurement vector that is the input to a classifier.
#它包括计算由连接部件标记算法产生的每个区域的全局属性。
每个区域或片段的属性被存储为一个测量向量,作为分类器的输入。
A variety of property measurements can be made on each region on the basis of the region's shape and the gray level values for those pixels that participate in the region. Examples:
1. Area 2. Centroid 3. Perimeter\
Perimeter:
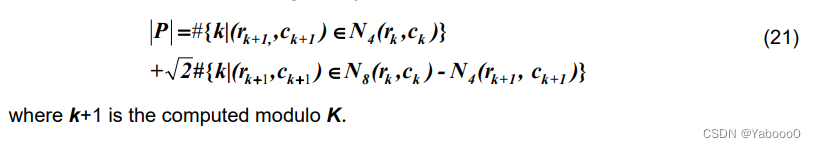
A simple definition of the perimeter of a region without holes is the sequence of its interior border pixels. A pixel of a region is a border pixel if it has some neighbouring pixel that is outside the region. To compute the length of the perimeter P, the pixels in the perimeter must be ordered in a sequence

and each pair of successive pixels in the sequence being neighbours, including the first and last pixels. Then the perimeter is given by: