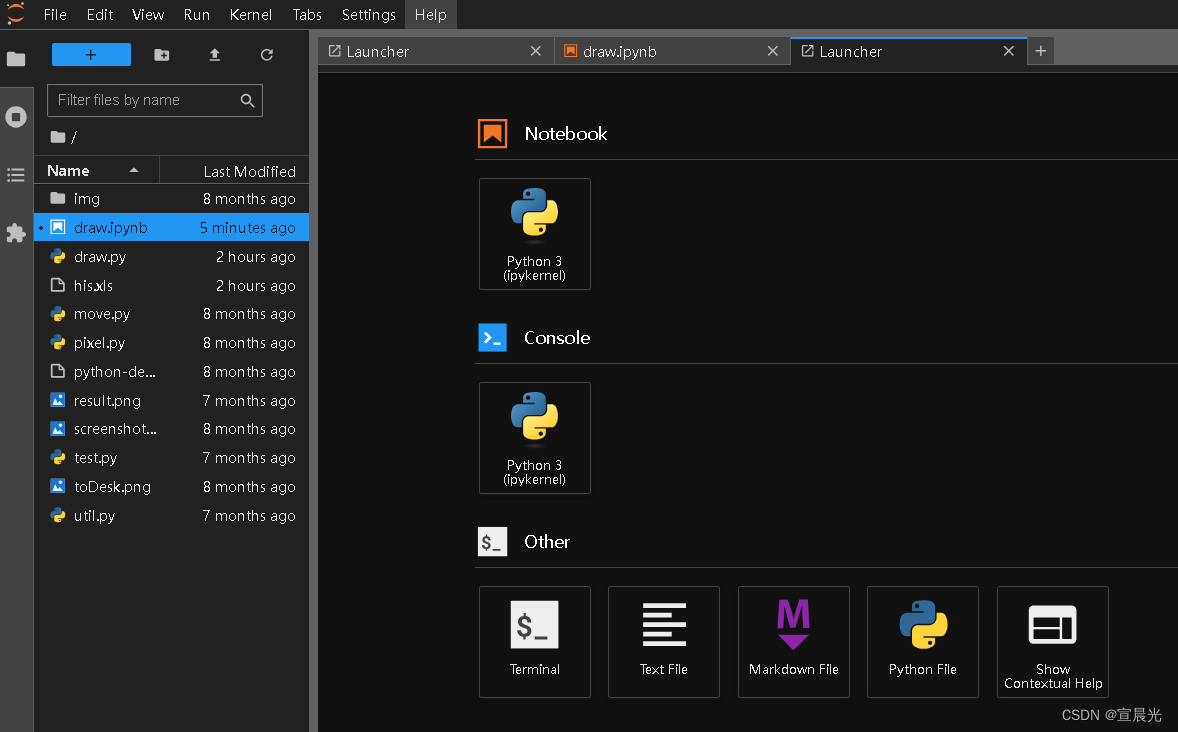
1、安装jupyter lab
pip install jupyterlab
# 启动 建议在指定的项目文件夹下 开启cmd窗口并执行
jupyter lab
启动后会自动打开浏览器访问
2、安装依赖
pip install matplotlib
pip install xlrd
pip install pandas
3、读取excel
import pandas as pd

df = pd.read_excel('his.xls')


# 读取列名
for i in df.columns:
    print(i)

df.columns[0]


# 读取指定sheet 名
filePath = 'his.xlsx'
df = pd.read_excel(r'his.xlsx', sheet_name=1)

# 场景2:excel 中第 2 行才是我们想要的标题(即:header=1)
df = pd.read_excel(filePath, header=1)

# 读取 Excel,指定索引列
df= pd.read_excel(filePath, index_col='ID')

# 读取前 3 行数据(默认 5 行)
print(df.head(3))

# 读取后 3 行数据(默认 5 行)
print(df.tail(3))

# 数据筛选
# 读取第一列所有数据
df.iloc[:, 0]
4、画图
多个子图
import pandas as pd
import numpy as np
import matplotlib.pyplot as plt

# 从上一步得到excel的列
columns = df.columns
size = columns.size

#新建一个画布
fig = plt.figure()

# 设置多行 一列的表格 figsize 用于设置画布大小  是否共享x轴坐标值 sharex
f, ax = plt.subplots(size, 1, figsize=(10,30), sharex= True, sharey=False)


for i in range(size):
    # 将每一列数据作为一个表格,用于绘制,如果是多列,则ax[i:xx]
    ax[i].plot(df.iloc[:, i])
    ax[i].set_title(columns[i])

plt.show()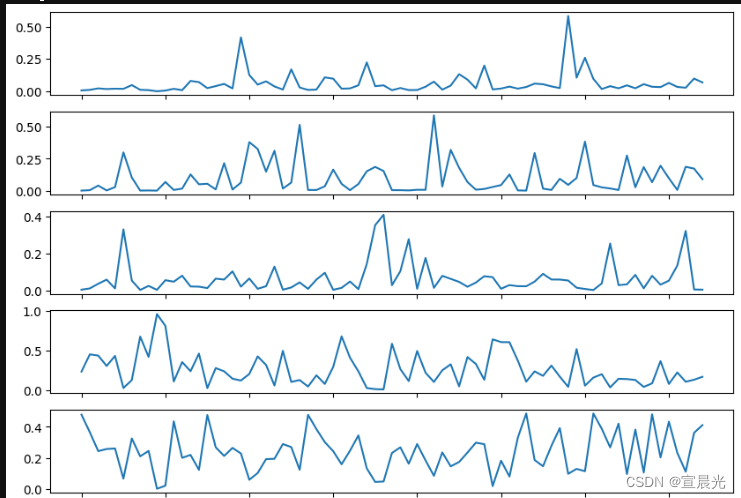
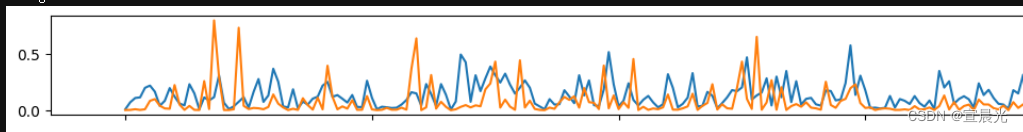
多组数据一组图
# c='black' 设置线条颜色
ax[0].plot(df.iloc[:, 0])
ax[0].plot(df.iloc[:, 1])